
- PRICING
- LIVE QUOTES
- LEARN
- HELP


EN
Why Galderma Group (SWX:GALD) Is Back In The Spotlight
Galderma Group (SWX:GALD) drew fresh attention after releasing new clinical data on nemolizumab and Nemluvio, showing sustained symptom control and stable safety results in adults, adolescents, and children with severe skin conditions.
Investors have been leaning into this story, with Galderma Group’s 1-month share price return of 10.65% and year to date share price return of 9.31% pointing to building momentum. The 1-year total shareholder return of 27.64% suggests recent clinical updates are being framed as a positive shift in growth prospects and perceived risk.
Scan how Galderma Group fits into the wider dermatology and healthcare story by comparing it with a curated basket of 126 healthcare AI stocks that are also pursuing data-driven treatment breakthroughs.
Galderma Group now trades at a double discount, around 12% below analyst targets and over 40% below some intrinsic estimates, after a sharp clinical news rally. Is that caution a warning sign, or an entry point on quality?
Most Popular Narrative: 11% Undervalued
Galderma Group’s most followed narrative pegs fair value at CHF197.55, above the last close at CHF175. This frames today’s discount as a bet on execution rather than a broken story.
The strong uptake and market share gains of newly launched products like Nemluvio and Relfydess, driven by their differentiated clinical profiles and positive physician reception, are likely to accelerate Galderma's top-line growth and expand the addressable market, especially as global population aging and heightened focus on appearance drive continued demand for dermatological and aesthetic treatments, positively impacting future revenues.
See why 13 investors see Galderma Group as 11% undervalued.
Result: Fair Value of CHF197.55 (UNDERVALUED)
Still, the Galderma Group story hinges heavily on Nemluvio and injectable aesthetics, so any regulatory setback or weaker demand could quickly challenge this 11% undervalued narrative.
Find out about the key risks to this Galderma Group narrative.
Another View: Rich Multiples Beside “Cheap” Fair Value
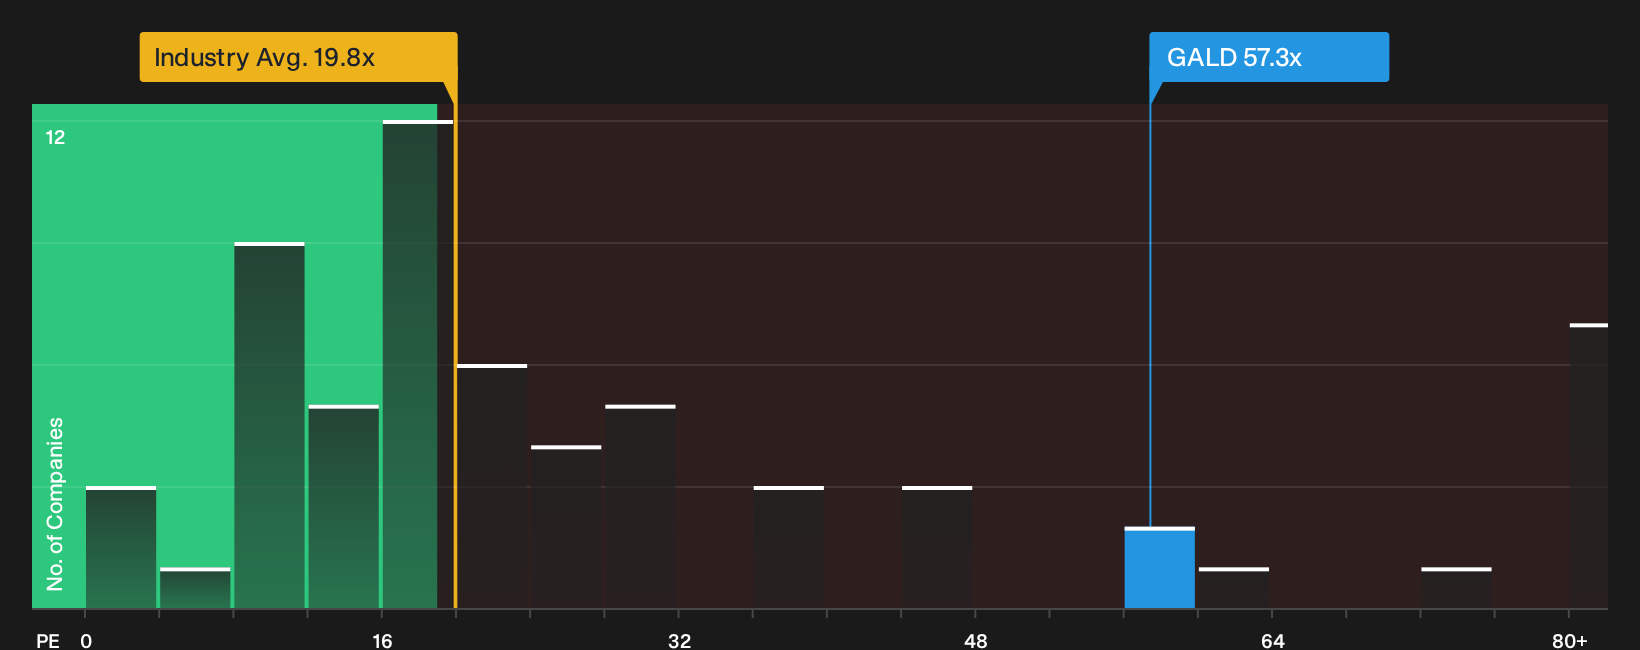
That 11% gap to Galderma Group’s CHF197.55 fair value and a 42.9% discount to intrinsic estimates sound appealing. Yet the stock trades on a P/E of 57.3x, compared with 19.8x for the European Pharmaceuticals industry, 36.9x for peers, and a fair ratio of 43.7x. Is the premium simply enthusiasm getting ahead of itself, or a price for quality that investors are willing to keep paying?
See what the numbers say about this price in our valuation breakdown, then decide which signal you trust more: the big discount to fair value or the rich earnings multiple. See what the numbers say about this price — find out in our valuation breakdown.
Next Steps
Does this upbeat tone around Galderma Group really match your own view, or is the crowd leaning too hard on recent wins and fair value gaps instead? Move quickly, test the bullish pillars against your own expectations, and pressure test the optimism by reviewing the 3 key rewards.
Looking for more Galderma Group sized ideas?
If Galderma Group has sharpened your appetite for focused research, do not stop here. Broaden your watchlist with targeted screeners that surface very different opportunities.
- Hunt for quality at a discount by scanning a curated set of companies trading below intrinsic estimates through the 188 high quality undervalued stocks.
- Anchor your portfolio with sturdier balance sheets by using the list of solid balance sheet and fundamentals (202 results) that highlights stronger financial foundations and cleaner leverage profiles.
- Get ahead of the crowd by reviewing the 616 high quality undiscovered gems that flags under-followed businesses with solid fundamentals before attention catches up.
Have feedback on this article? Concerned about the content? Get in touch with us directly. Alternatively, email editorial-team@simplywallst.com