
- PRICING
- LIVE QUOTES
- LEARN
- HELP


EN
3 Undiscovered Gems In Asia With Promising Potential
As global markets experience a rotation from large-cap growth stocks to more value-oriented and defensive segments, the Asian market presents intriguing opportunities for investors seeking undiscovered gems. With recent shifts in economic indicators and broader market sentiment impacting small-cap stocks, identifying companies with strong fundamentals and growth potential becomes crucial.
Top 10 Undiscovered Gems With Strong Fundamentals In Asia
| Name | Debt To Equity | Revenue Growth | Earnings Growth | Health Rating |
|---|---|---|---|---|
| Apex Mining | 22.02% | 24.39% | 37.14% | ★★★★★★ |
| Ad-Sol Nissin | NA | 7.22% | 15.60% | ★★★★★★ |
| Chongqing Machinery & Electric | 18.92% | 8.43% | 26.16% | ★★★★★★ |
| Xiamen King Long Motor Group | 93.39% | 11.34% | 66.65% | ★★★★★☆ |
| Forth Smart Service | 44.85% | -3.80% | 10.19% | ★★★★★☆ |
| Silvery Dragon Group Tianjin | 25.01% | 2.55% | 25.62% | ★★★★★☆ |
| Sing Investments & Finance | 0.10% | 5.85% | 7.00% | ★★★★☆☆ |
| Shengda ResourcesLtd | 57.58% | 8.61% | 9.90% | ★★★☆☆☆ |
| Primo Global Holdings | 64.63% | 9.93% | 28.27% | ★★★☆☆☆ |
| HANA Micron | 137.37% | 21.15% | 26.62% | ★★★☆☆☆ |
Here we highlight a subset of our preferred stocks from the screener.
China Lilang (SEHK:1234)
Simply Wall St Value Rating: ★★★★★☆
Overview: China Lilang Limited, along with its subsidiaries, focuses on the manufacturing and sale of branded menswear and accessories in China, with a market capitalization of HK$3.23 billion.
Operations: The company recorded revenue of CN¥4.41 billion from its manufacturing and sale of menswear and accessories.
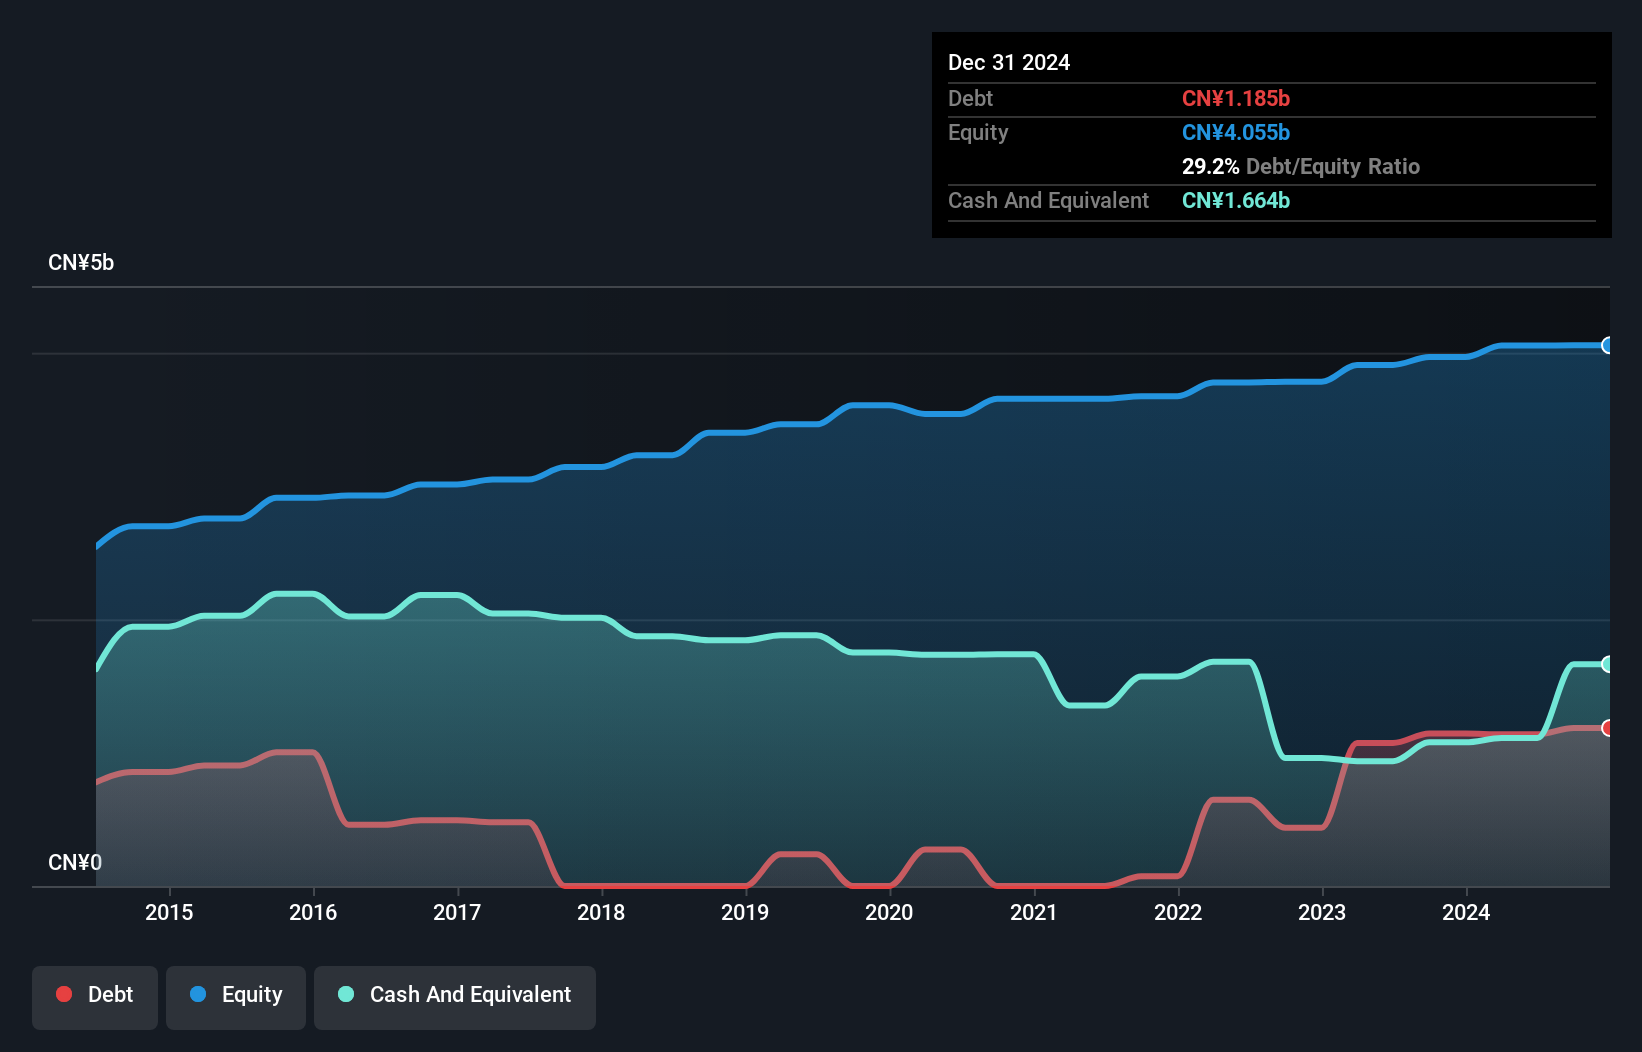
China Lilang, a clothing company in the luxury sector, seems to be trading at a good value compared to its peers, with shares priced 49.7% below estimated fair value. Over the past year, earnings grew by 12.2%, outpacing the luxury industry's growth of 7.7%. Despite an increase in debt-to-equity ratio from 0% to 17.6% over five years, it holds more cash than total debt and remains profitable with free cash flow positive status. Recent reports show sales increased to CNY 2 billion for H1 2026; however, net income dropped slightly to CNY 215 million from CNY 243 million last year.
- Take a closer look at China Lilang's potential here in our health report.
Understand China Lilang's track record by examining our Past report.
Inner Mongolia Xingye Silver & Tin Mining (SZSE:000426)
Simply Wall St Value Rating: ★★★★★★
Overview: Inner Mongolia Xingye Silver & Tin Mining Co., Ltd operates in the non-ferrous metal mining and beneficiation sector across China and Mongolia, with a market capitalization of approximately CN¥50.66 billion.
Operations: Inner Mongolia Xingye Silver & Tin Mining generates its revenue primarily from the mining industry, amounting to CN¥7.36 billion. The company's financial performance is influenced by its cost structure and market conditions within the non-ferrous metal sector.
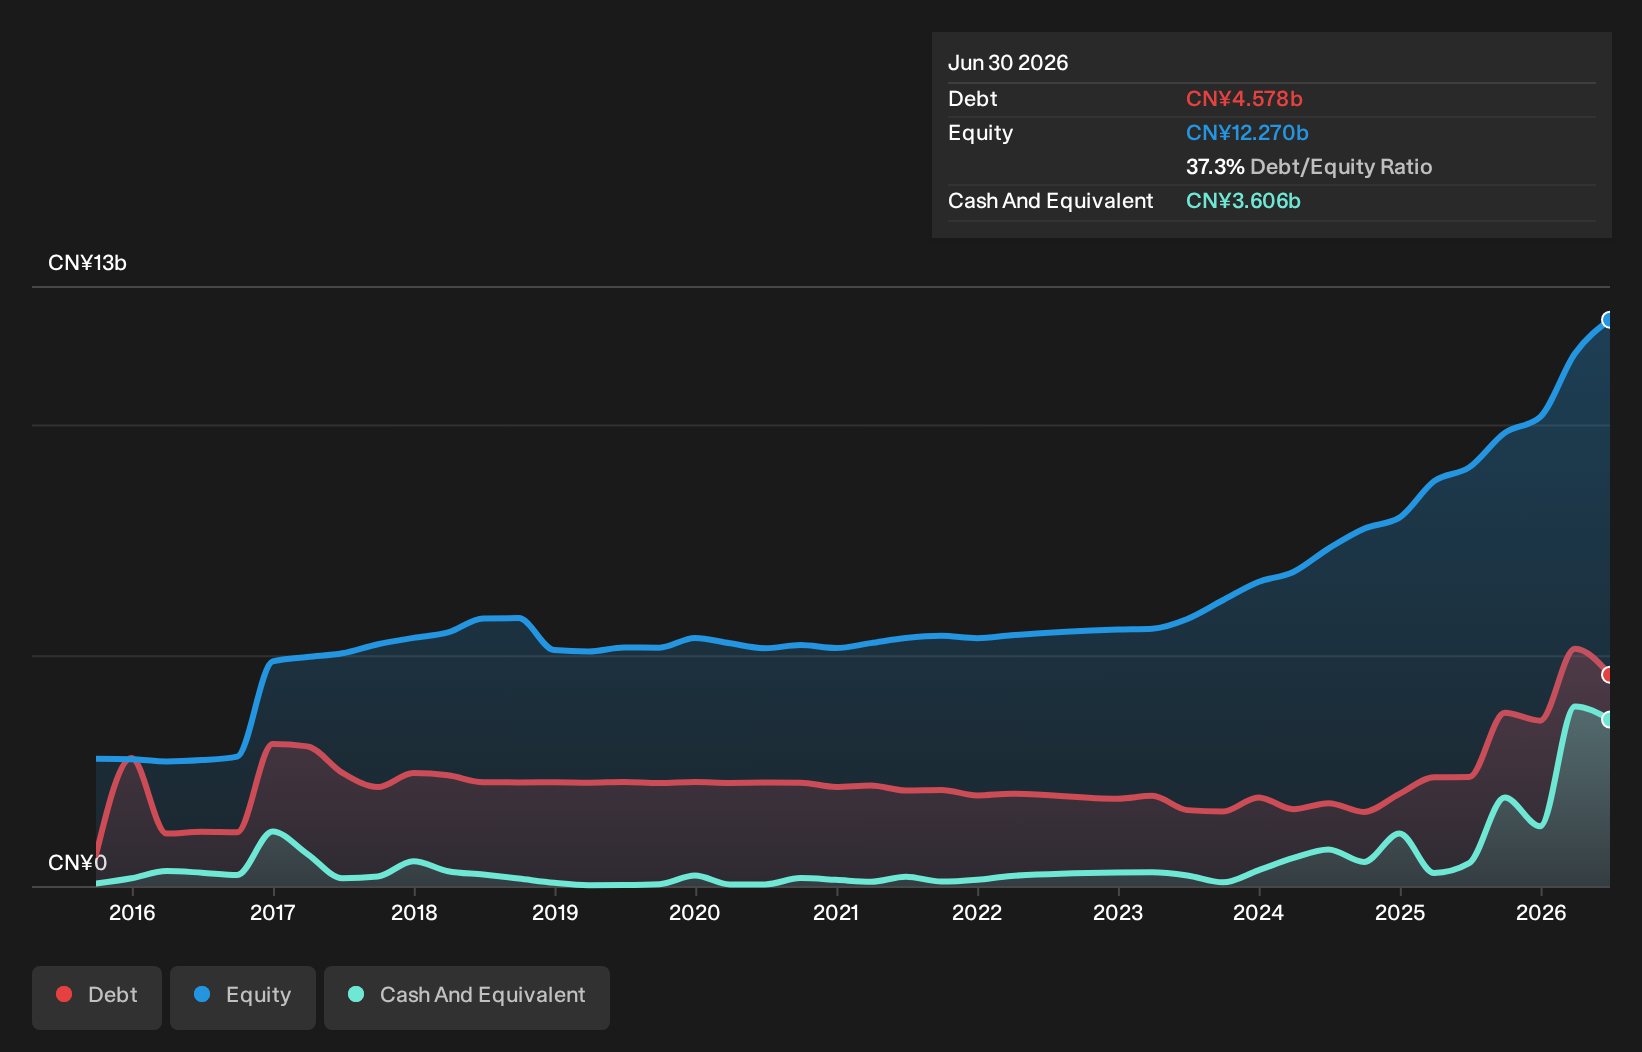
Inner Mongolia Xingye Silver & Tin Mining, a nimble player in the metals and mining sector, has showcased impressive financial performance. Over the past year, earnings surged by 119.9%, outpacing the industry average of 23.3%. The company trades at a compelling value, estimated to be 68% below its fair price. Its net debt to equity ratio stands at a satisfactory 7.9%, reflecting prudent financial management over five years as it reduced from 38.5% to 37.3%. Recent dividends and shareholder meetings indicate active engagement with investors and strategic adjustments in business operations, underscoring its dynamic approach in navigating market conditions.
Shannon Semiconductor TechnologyLtd (SZSE:300475)
Simply Wall St Value Rating: ★★★★★★
Overview: Shannon Semiconductor Technology Co., Ltd. operates in the semiconductor industry, focusing on the design, development, and production of advanced semiconductor products with a market cap of CN¥53.73 billion.
Operations: Shannon Semiconductor Technology Ltd generates its revenue primarily through the design, development, and production of semiconductor products. The company has a market capitalization of CN¥53.73 billion.
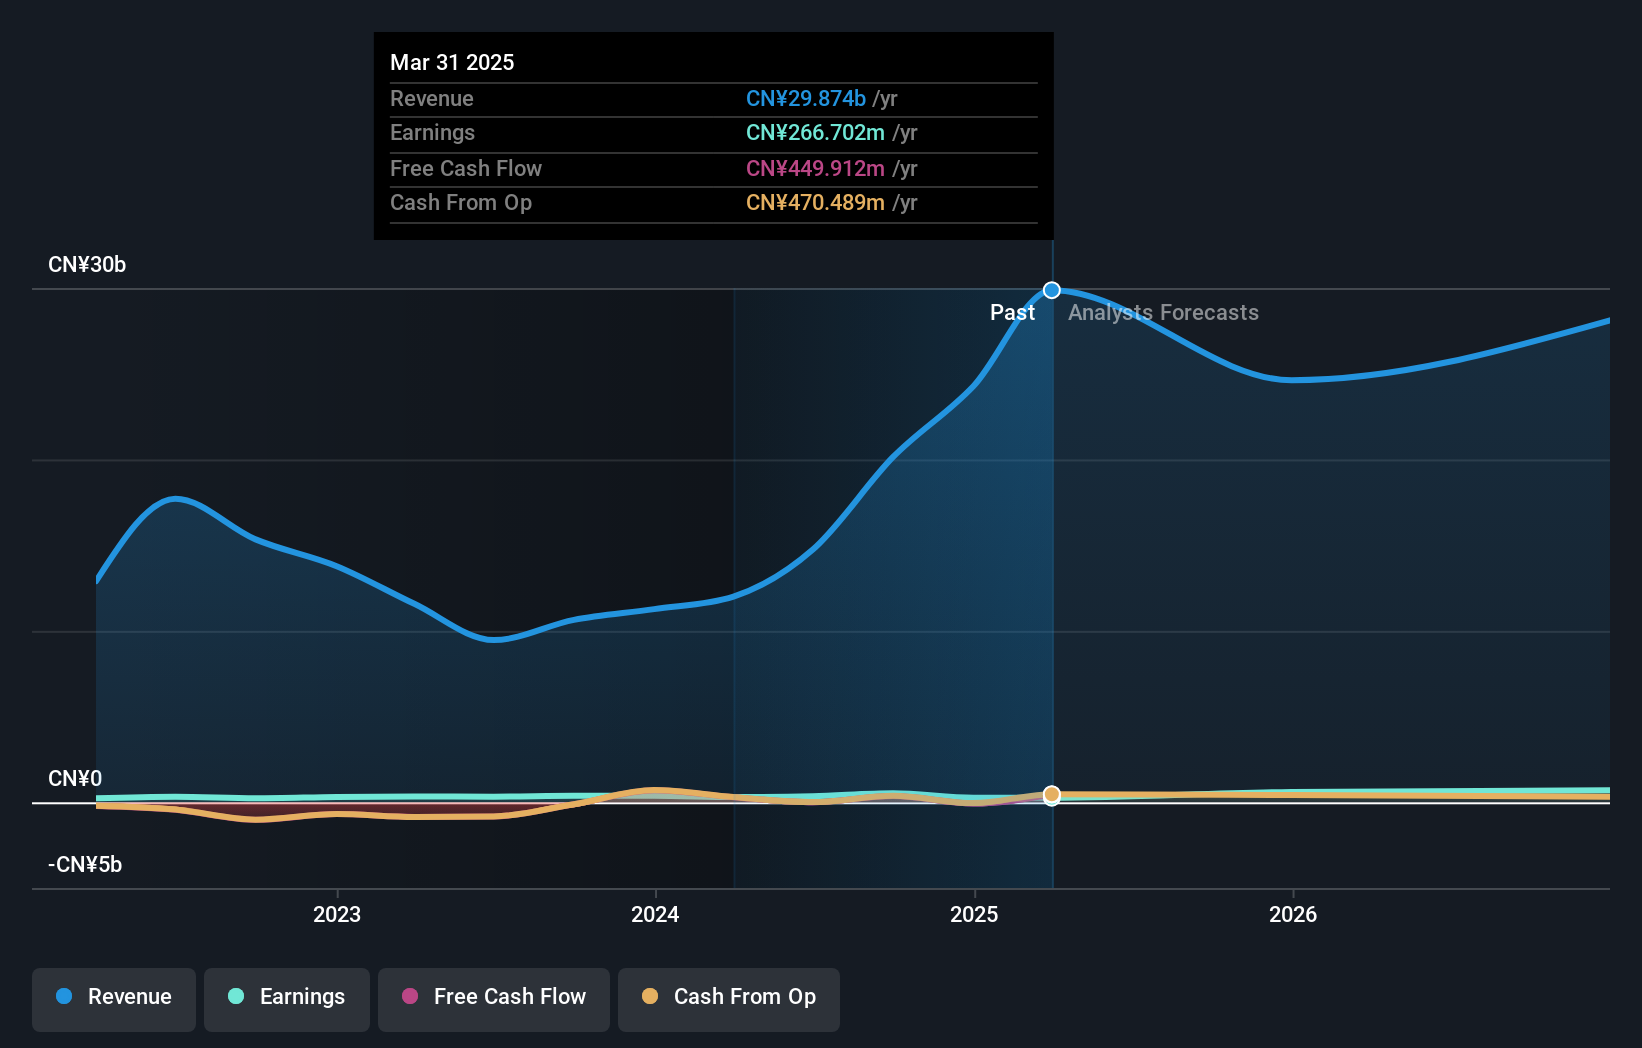
Shannon Semiconductor Technology, a nimble player in the semiconductor space, has showcased impressive growth with earnings surging by CNY 3.64 billion for the half-year ended June 2026, up from CNY 157.83 million last year. The company's basic earnings per share jumped to CNY 7.82 from just CNY 0.34 a year ago, reflecting its robust performance in revenue generation which hit CNY 60.20 billion compared to the previous year's CNY 17.12 billion. Despite recent volatility in its share price, Shannon's debt-to-equity ratio improved over five years from 67.7% to 60.6%, indicating better financial health and stability moving forward.
Next Steps
- Reveal the 131 hidden gems among our Asian Undiscovered Gems With Strong Fundamentals screener with a single click here.
- Already own these companies? Link your portfolio to Simply Wall St and get alerts on any new warning signs to your stocks.
- Elevate your portfolio with Simply Wall St, the ultimate app for investors seeking global market coverage.
Ready For A Different Approach?
- Explore high-performing small cap companies that haven't yet garnered significant analyst attention.
- Fuel your portfolio with companies showing strong growth potential, backed by optimistic outlooks both from analysts and management.
- Find companies with promising cash flow potential yet trading below their fair value.
This article by Simply Wall St is general in nature. We provide commentary based on historical data and analyst forecasts only using an unbiased methodology and our articles are not intended to be financial advice. It does not constitute a recommendation to buy or sell any stock, and does not take account of your objectives, or your financial situation. We aim to bring you long-term focused analysis driven by fundamental data. Note that our analysis may not factor in the latest price-sensitive company announcements or qualitative material. Simply Wall St has no position in any stocks mentioned.
Have feedback on this article? Concerned about the content? Get in touch with us directly. Alternatively, email editorial-team@simplywallst.com