
- PRICING
- LIVE QUOTES
- LEARN
- HELP


EN
3 Asian Stocks Estimated To Be Trading At Up To 40.2% Below Intrinsic Value
As global markets grapple with concerns over AI spending and inflation pressures, Asian equities have been particularly impacted, with technology-heavy indices facing significant sell-offs. Amidst this volatility, discerning investors might find opportunities in stocks that are trading below their intrinsic value, offering potential for long-term growth despite current market challenges.
Top 10 Undervalued Stocks Based On Cash Flows In Asia
| Name | Current Price | Fair Value (Est) | Discount (Est) |
| Wacom (TSE:6727) | ¥832.00 | ¥1624.92 | 48.8% |
| Riken Technos (TSE:4220) | ¥2419.00 | ¥4769.19 | 49.3% |
| PAL GROUP Holdings (TSE:2726) | ¥1465.00 | ¥2912.16 | 49.7% |
| Nissui (TSE:1332) | ¥1106.00 | ¥2168.23 | 49% |
| Kumagai GumiLtd (TSE:1861) | ¥1203.00 | ¥2405.85 | 50% |
| Kingnet Network (SZSE:002517) | CN¥15.33 | CN¥30.54 | 49.8% |
| Inner Mongolia ERDOS ResourcesLtd (SHSE:600295) | CN¥14.31 | CN¥28.25 | 49.3% |
| ENN Energy Holdings (SEHK:2688) | HK$49.20 | HK$97.21 | 49.4% |
| Double Medical Technology (SZSE:002901) | CN¥39.77 | CN¥78.97 | 49.6% |
| Apex Mining (PSE:APX) | ₱16.92 | ₱33.29 | 49.2% |
We're going to check out a few of the best picks from our screener tool.
Osotspa (SET:OSP)
Overview: Osotspa Public Company Limited, with a market cap of THB49.56 billion, manufactures and distributes energy drinks and personal care products in Thailand and internationally through its subsidiaries.
Operations: The company generates revenue from two main segments: beverages, contributing THB20.41 billion, and personal care products, amounting to THB2.92 billion.
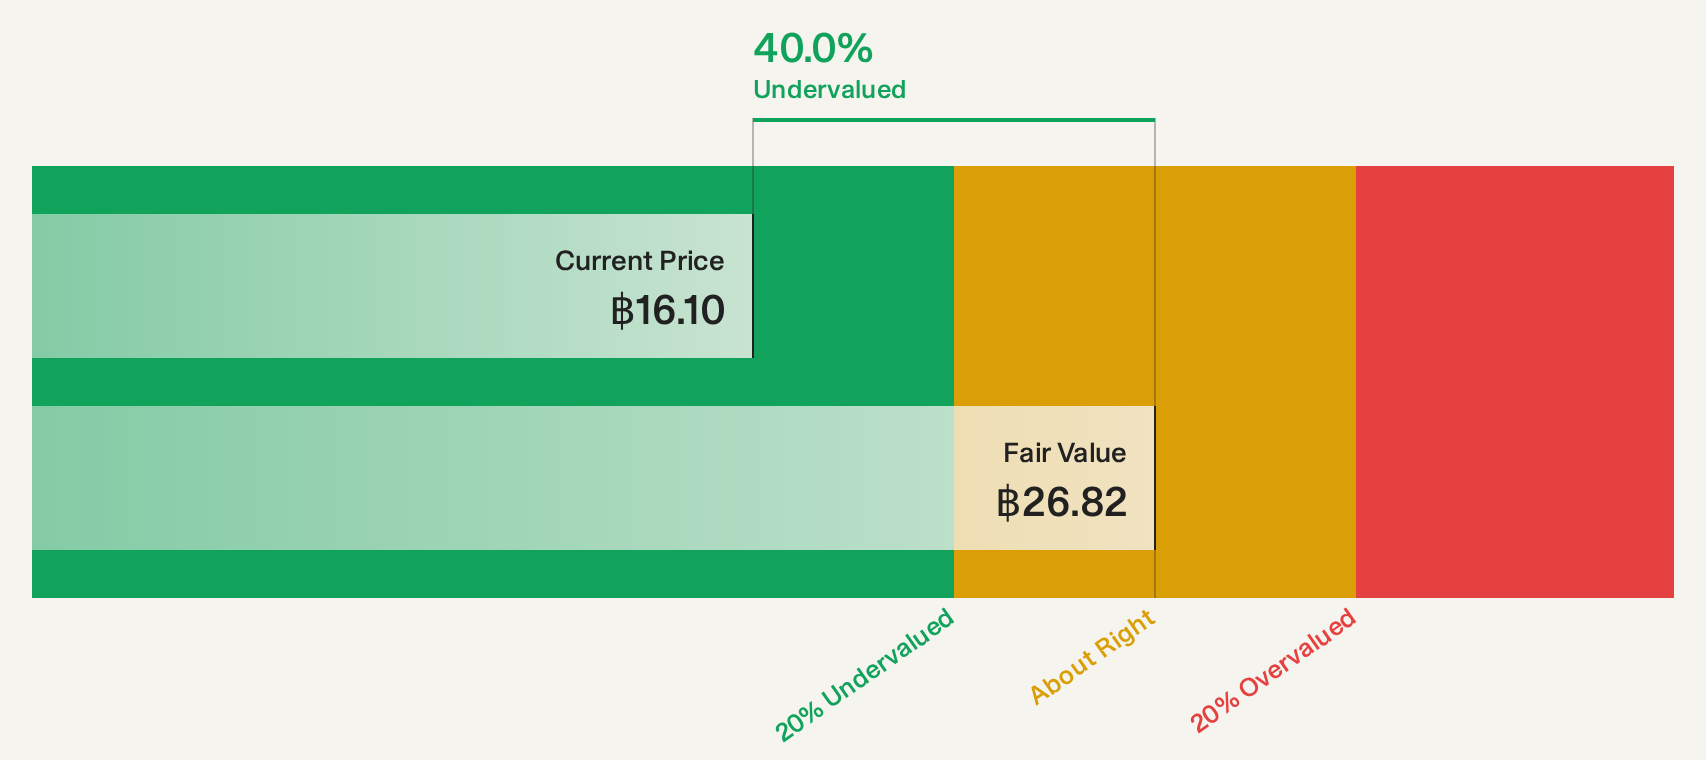
Estimated Discount To Fair Value: 38%
Osotspa is trading at 38% below its estimated fair value, with a current price of THB16.5 compared to a future cash flow valuation of THB26.61, indicating significant undervaluation. Despite recent earnings growth of 47.1%, future profit and revenue growth are forecasted to be slower than the Thai market average. The company's dividend track record remains unstable, and recent executive changes in the CFO position may impact financial strategies moving forward.
- Our comprehensive growth report raises the possibility that Osotspa is poised for substantial financial growth.
- Click here and access our complete balance sheet health report to understand the dynamics of Osotspa.
SRA Holdings (TSE:3817)
Overview: SRA Holdings, Inc. offers software development and maintenance services both in Japan and internationally, with a market capitalization of ¥58.89 billion.
Operations: SRA Holdings generates revenue through its software development and maintenance services, operating both domestically in Japan and internationally.
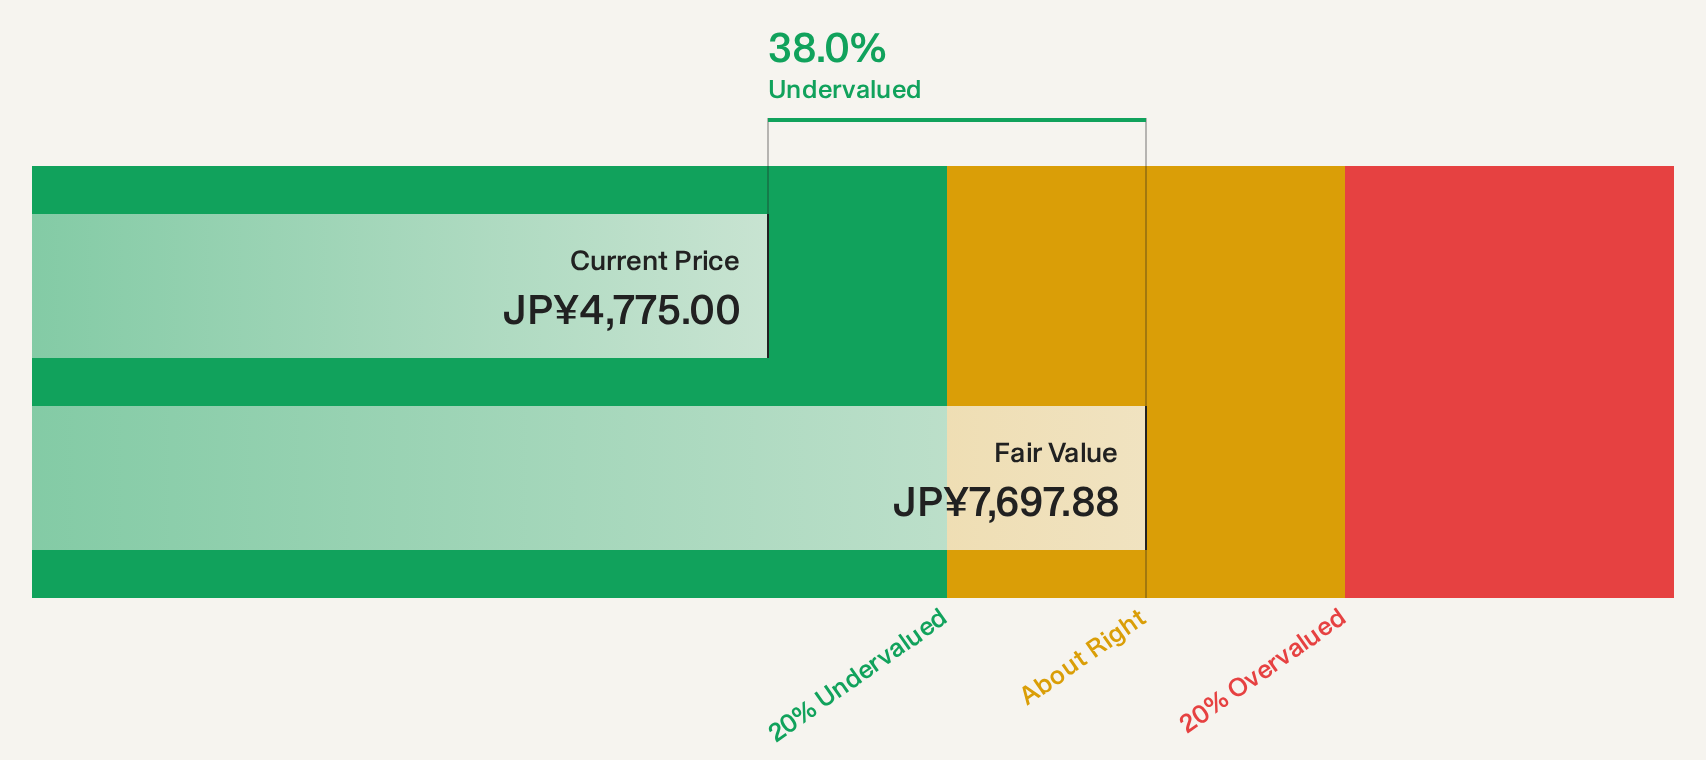
Estimated Discount To Fair Value: 40.2%
SRA Holdings is trading at ¥4,775, significantly below its estimated future cash flow value of ¥7,987.53. Despite a recent 96.4% earnings growth, future profit and revenue growth are expected to lag behind the Japanese market averages. The company offers a reliable dividend yield of 4.61%. Recent share buybacks totaling ¥1,375 million may bolster shareholder value but do not offset slower anticipated growth rates compared to industry peers.
- The growth report we've compiled suggests that SRA Holdings' future prospects could be on the up.
- Navigate through the intricacies of SRA Holdings with our comprehensive financial health report here.
Alpha Systems (TSE:4719)
Overview: Alpha Systems Inc. develops software for telecommunications systems in Japan and has a market cap of ¥44.92 billion.
Operations: Alpha Systems Inc.'s revenue segments include software development for telecommunications systems in Japan.
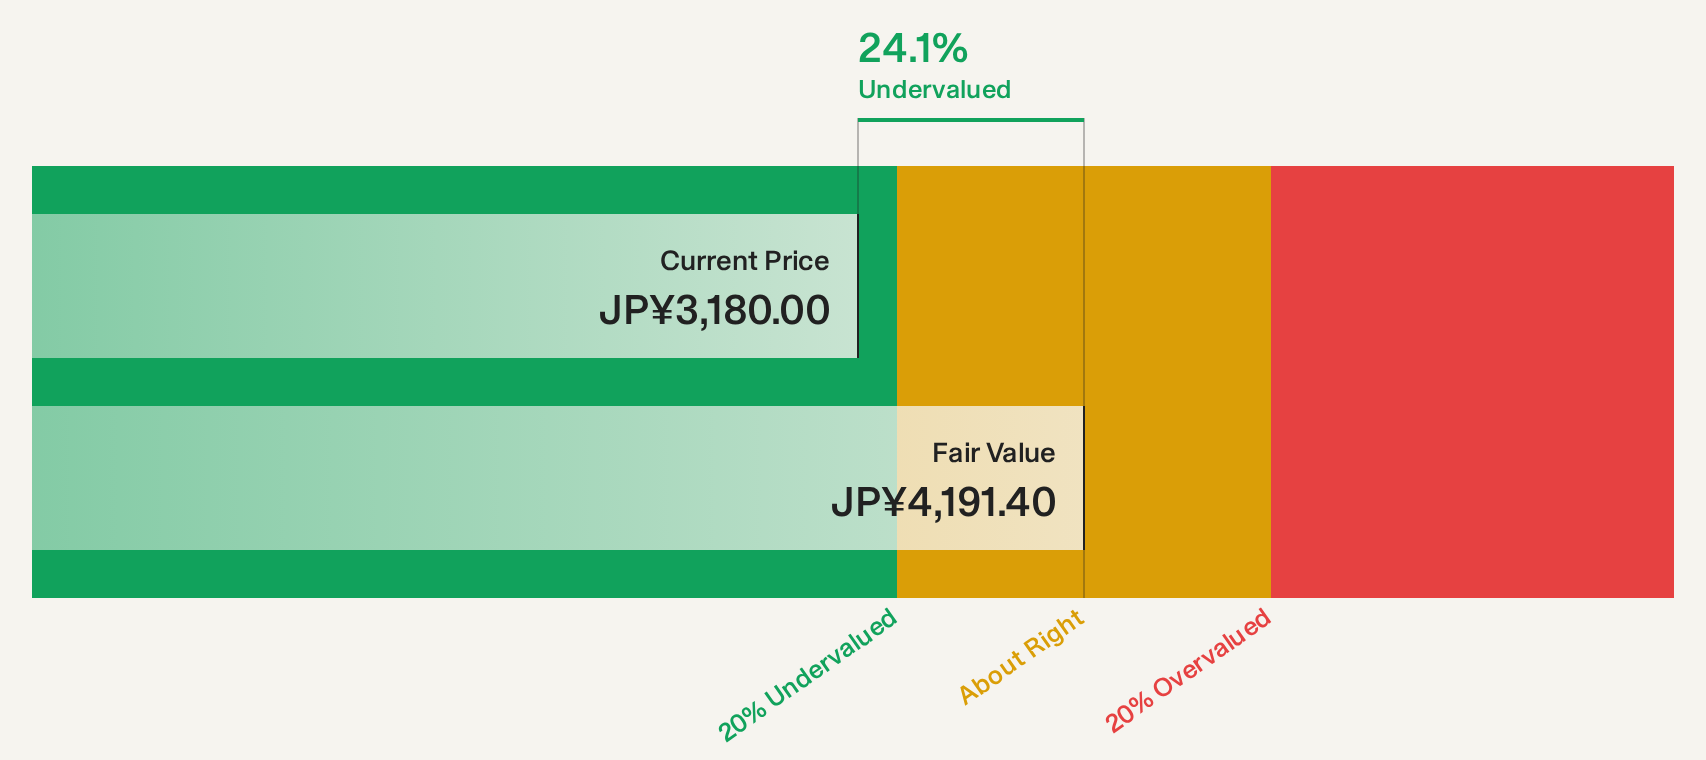
Estimated Discount To Fair Value: 23.7%
Alpha Systems is trading at ¥3,200, below its estimated future cash flow value of ¥4,193.11. The stock offers good relative value compared to peers and the industry. However, earnings growth is projected at 2.51% annually, slower than the Japanese market's 9.5%. Revenue growth forecasts also trail market averages at 4.6% per year versus 6.6%. A recent cash dividend of ¥70 was declared for September 2026 distribution.
- According our earnings growth report, there's an indication that Alpha Systems might be ready to expand.
- Click here to discover the nuances of Alpha Systems with our detailed financial health report.
Summing It All Up
- Click here to access our complete index of 182 Undervalued Asian Stocks Based On Cash Flows.
- Already own these companies? Bring clarity to your investment decisions by linking up your portfolio with Simply Wall St, where you can monitor all the vital signs of your stocks effortlessly.
- Simply Wall St is your key to unlocking global market trends, a free user-friendly app for forward-thinking investors.
Looking For Alternative Opportunities?
- Explore high-performing small cap companies that haven't yet garnered significant analyst attention.
- Diversify your portfolio with solid dividend payers offering reliable income streams to weather potential market turbulence.
- Fuel your portfolio with companies showing strong growth potential, backed by optimistic outlooks both from analysts and management.
This article by Simply Wall St is general in nature. We provide commentary based on historical data and analyst forecasts only using an unbiased methodology and our articles are not intended to be financial advice. It does not constitute a recommendation to buy or sell any stock, and does not take account of your objectives, or your financial situation. We aim to bring you long-term focused analysis driven by fundamental data. Note that our analysis may not factor in the latest price-sensitive company announcements or qualitative material. Simply Wall St has no position in any stocks mentioned.
Have feedback on this article? Concerned about the content? Get in touch with us directly. Alternatively, email editorial-team@simplywallst.com