
- PRICING
- LIVE QUOTES
- LEARN
- HELP


EN
Why Did Dynex Capital (DX) Stock Drop Today?
Dynex Capital (DX) shares are reacting to a material third quarter update, with the mortgage REIT reporting a net loss of US$335.54 million and a 15.4% decline in book value per common share.
The third quarter loss and 15.4% drop in book value come on top of a weak share price run, with Dynex Capital’s stock down 13.3% on a 1 month share price basis and 25% year to date. However, the 3 year total shareholder return of 58.77% still reflects a stronger longer term outcome.
Compare how Dynex Capital stacks up against other mortgage and income-focused plays by scanning our hand picked 8 dividend fortresses currently yielding above 5%.
Dynex Capital now appears to be a stronger, more liquid mortgage REIT facing a sharply weaker quarter. The key point for investors is whether that combination results in a fair price or a mispriced income play.
Price-to-Earnings of 6.1x: Is it justified?
The valuation question around Dynex Capital starts with its P/E of 6.1x, which screens as inexpensive compared to the wider US market yet richer than some direct peers. With the last close at $10.56, investors are effectively paying a relatively low multiple for each dollar of recent earnings, even after a tough run for the share price.
P/E is a quick shorthand for what the market is willing to pay today for the trust’s current earnings power. For a mortgage REIT like Dynex Capital, that figure often reflects expectations around future earnings resilience, funding costs, and how well management can manage its portfolio through rate cycles.
Against the broader US Mortgage REITs industry average of 7.7x, Dynex Capital trades at a clear discount. That gap suggests investors are pricing the stock more cautiously than the sector as a whole. Compared to a peer group average P/E of 4.5x though, the shares look more expensive, which points to expectations that Dynex Capital’s earnings profile or balance sheet quality justify a richer tag. Relative to the estimated fair P/E of 11.6x, the market valuation looks much lower, which is a level the share price could move toward if those earnings prove durable.
Explore the SWS fair ratio for Dynex Capital.
Result: Price-to-Earnings of 6.1x (UNDERVALUED)
Still, the recent 15.4% decline in book value and the 1 year total return that fell 8.24% show how quickly sentiment around Dynex Capital can reset if quarterly results disappoint.
Find out about the key risks to this Dynex Capital narrative.
Another View: Cash Flow Signals A Deeper Discount
On earnings multiples, Dynex Capital already screens as inexpensive, yet the SWS DCF model paints an even starker picture. With the shares at $10.56 and the model estimating future cash flow value at $19.85, the stock screens as heavily undervalued on cash flows rather than just recent profit.
A gap that wide can reflect genuine opportunity or a market that doubts those cash flows will materialise. For an income focused REIT with a volatile quarter behind it, which side of that trade do you think is more realistic?
Look into how the SWS DCF model arrives at its fair value.
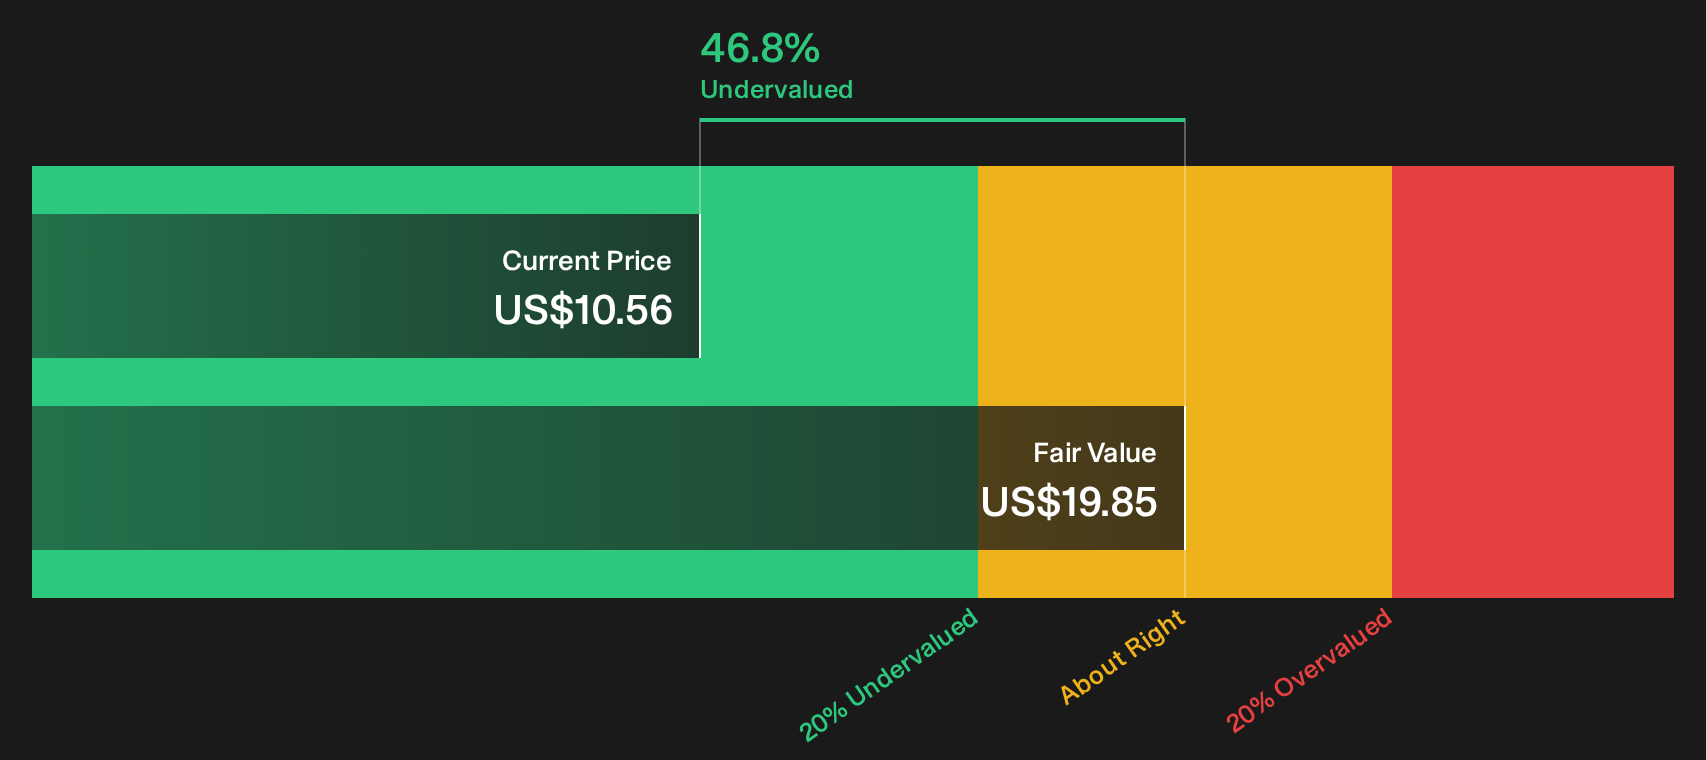
Simply Wall St performs a discounted cash flow (DCF) on every stock in the world every day (check out Dynex Capital for example). We show the entire calculation in full. You can track the result in your watchlist or portfolio and be alerted when this changes, or use our stock screener to discover 35 high quality undervalued stocks. If you save a screener we even alert you when new companies match - so you never miss a potential opportunity.
Next Steps
Mixed signals like Dynex Capital’s are exactly when your own homework matters most. Move quickly, review the full data set, then weigh the 4 key rewards and 3 important warning signs.
Looking for more investment ideas beyond Dynex Capital?
If Dynex Capital has your attention, do not stop here. Fresh watchlist candidates often come from scanning quality filters that surface opportunities you might otherwise miss.
- Target resilient cash generators by reviewing the 35 high quality undervalued stocks that combine quality fundamentals with valuation support.
- Strengthen portfolio stability by scanning the list of solid balance sheet and fundamentals (25 results) for companies with robust financial footing.
- Get ahead of the crowd by checking the 20 high quality undiscovered gems that rarely appear on typical stock radars.
Have feedback on this article? Concerned about the content? Get in touch with us directly. Alternatively, email editorial-team@simplywallst.com