
- PRICING
- LIVE QUOTES
- LEARN
- HELP


EN
Fujimi (TSE:5384) Lifts Guidance And Dividends, Is The Valuation Too Expensive?
Why Fujimi’s guidance reset matters for investors
Fujimi (TSE:5384) just lifted its earnings outlook and raised dividend forecasts after stronger than expected demand for CMP and silicon wafer products, while also laying out fresh multi year net sales targets.
The upgraded guidance landed after a choppy stretch for Fujimi’s shares, with the stock down 16.35% on a 90 day share price return and weaker over the past week, yet still showing a 40.64% year to date share price return and a 41.68% 1 year total shareholder return, which points to momentum built over a longer horizon.
Scan opportunities that follow similar semiconductor demand trends as Fujimi with a curated set of 55 AI infrastructure stocks in the supply chain behind chips, data centers, and AI hardware.
Fujimi now trades well below both analyst targets and some intrinsic value estimates, even after the guidance lift. Is that discount a warning sign that the market has this story right, or an opportunity that it is mispricing?
Price-to-earnings of 23.5x for Fujimi: Is it justified?
Fujimi last closed at ¥3,350, while several valuation checks flag a mismatch between that share price and what some models suggest it could be worth. At the same time, the stock trades on a richer earnings multiple than both its chemicals peers and the level implied by its own fair-value estimates.
The preferred yardstick here is the P/E ratio, which sits at 23.5x for Fujimi. This metric compares what you pay per share to the company’s earnings per share, so it captures how much investors are currently willing to pay for each unit of profit.
For this ticker, the SWS DCF model estimates a future cash flow value of ¥6,681.32 per share, which is around 49.9% above the last close of ¥3,350. That points to a wide gap between the cash-flow-based value and the market price. The business still carries a value score of 2 and earnings growth is forecast at 18.3% per year, which is ahead of the wider JP market forecast of 9.5% but defined as not significantly high in this framework.
Against that cash flow backdrop, the 23.5x P/E looks heavy compared to both the JP Chemicals industry average of 13x and the peer average of 13.5x. It is also above the estimated fair P/E of 18.4x. This is the level that regression analysis suggests the market could move towards if pricing lined up more closely with underlying fundamentals.
Explore the SWS fair ratio for Fujimi.
Result: Price-to-earnings of 23.5x (OVERVALUED)
Still, Fujimi’s premium P/E can quickly look fragile if semiconductor capital spending cools or if rivals push more aggressive pricing in CMP and wafer consumables.
Find out about the key risks to this Fujimi narrative.
Another view on Fujimi’s value
The P/E screen paints Fujimi as expensive, yet the SWS DCF model tells a different story. On that cash flow view, an estimated value of ¥6,681.32 per share against a market price of ¥3,350 suggests the stock screens as undervalued. Which lens do you trust more when the signals conflict?
Look into how the SWS DCF model arrives at its fair value.
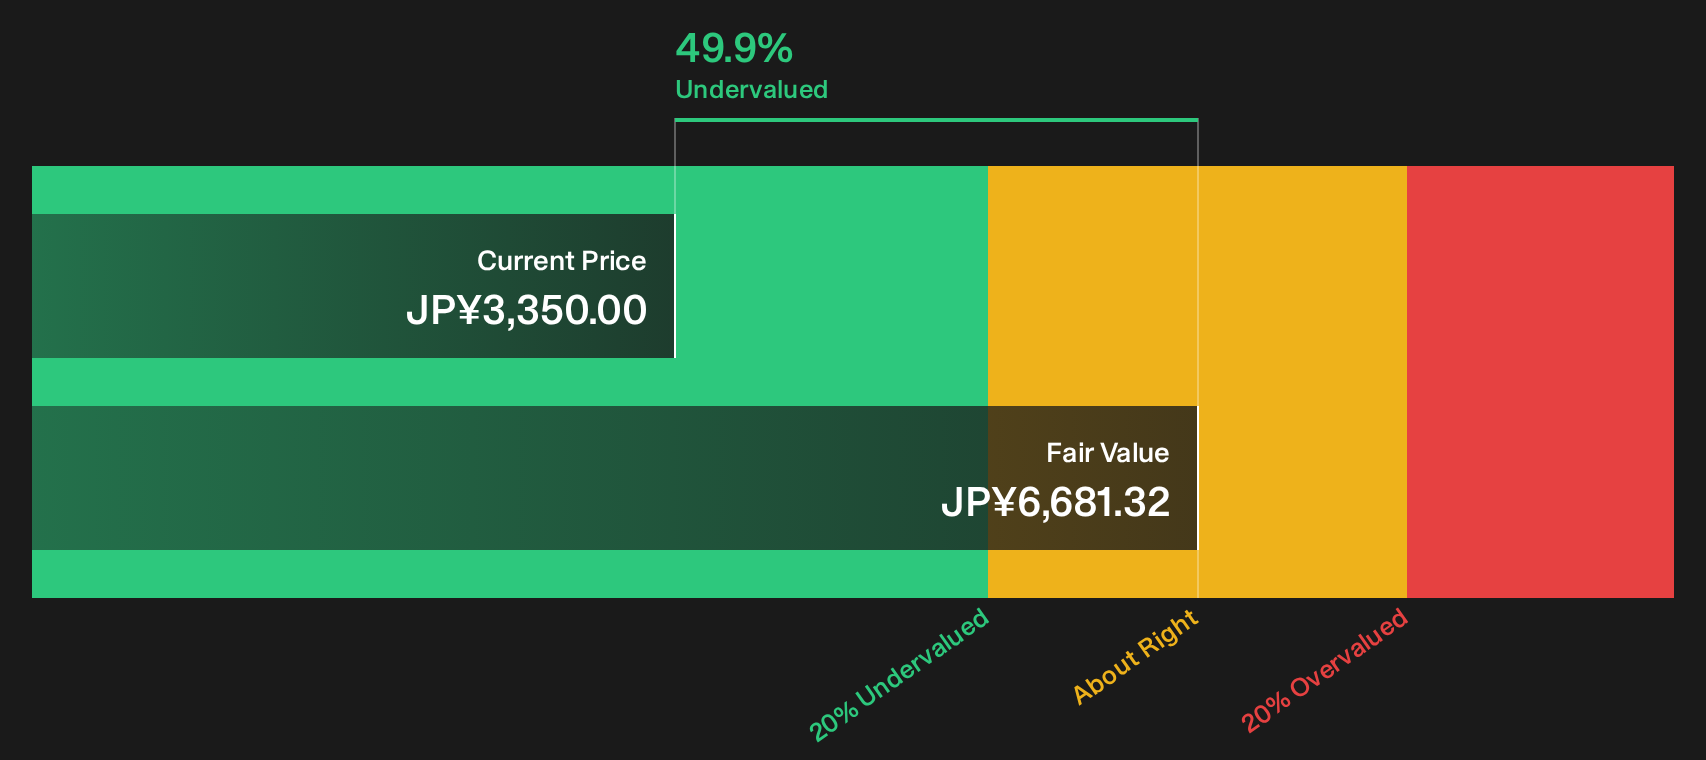
Simply Wall St performs a discounted cash flow (DCF) on every stock in the world every day (check out Fujimi for example). We show the entire calculation in full. You can track the result in your watchlist or portfolio and be alerted when this changes, or use our stock screener to discover 13 high quality undervalued stocks. If you save a screener we even alert you when new companies match - so you never miss a potential opportunity.
Next Steps
Mixed signals on Fujimi’s valuation and guidance can feel confusing, so move quickly and pull up the data. Then pressure test both sides of the story using 3 key rewards and 2 important warning signs
Looking for more investment ideas beyond Fujimi?
Do not stop at Fujimi. Use the data already in front of you, then widen the lens and line up a few more high conviction watchlist candidates.
- Target quality at a discount by scanning a 13 high quality undervalued stocks that couples strong fundamentals with prices that still sit below some valuation checks.
- Lock in potential income streams by reviewing a 29 dividend fortresses built around higher yielding payers with an eye on consistency and balance sheet support.
- Dial back portfolio stress and focus on resilience through a 22 resilient stocks with low risk scores that filters for steadier financial profiles and lower overall risk scores.
This article by Simply Wall St is general in nature. We provide commentary based on historical data and analyst forecasts only using an unbiased methodology and our articles are not intended to be financial advice. It does not constitute a recommendation to buy or sell any stock, and does not take account of your objectives, or your financial situation. We aim to bring you long-term focused analysis driven by fundamental data. Note that our analysis may not factor in the latest price-sensitive company announcements or qualitative material. Simply Wall St has no position in any stocks mentioned.
Have feedback on this article? Concerned about the content? Get in touch with us directly. Alternatively, email editorial-team@simplywallst.com