
- PRICING
- LIVE QUOTES
- LEARN
- HELP


EN
Union Tool (TSE:6278) Expands Factory Plans, Is The Upside Already Priced In?
Union Tool’s New Factory Plans Put Long Term Capacity In Focus
Union Tool (TSE:6278) has put bricks and mortar on the agenda. The board has approved construction of Mitsuke No. 4 Factory and has kicked off groundwork for another production site in Niigata Prefecture.
Recent trading has been choppy for Union Tool. The share price is up 64.78% year to date, while the 90 day share price return declined 19.51% and the 7 day move fell 11.37%. At the same time, the 1 year total shareholder return reached 106.56%, and the 5 year total shareholder return climbed more than 3x.
Spot capacity-driven opportunities like Union Tool by scanning our hand picked 92 robotics and automation stocks that benefit from automation demand and long term factory investment themes.After a 1 year total return of 106.56% and a 5 year gain of more than 3x, yet with a recent 90 day pullback, is Union Tool still pricing in meaningful upside, or has most of the move already happened before the valuation checks begin?
Preferred P/E Of 30.2x For Union Tool: Is It Justified?
On the simple numbers, Union Tool trades on a P/E of 30.2x, which sits well above both peer and industry averages, even after the recent pullback from the highs and the last close at ¥14,270.
The P/E ratio compares a company’s share price to its earnings per share and is often used as a shorthand for how much investors are willing to pay for each unit of profit. For a machinery manufacturer that designs and sells PCB drills, carbide end mills and other cutting tools across Japan, Asia, Europe and North America, that multiple effectively reflects expectations for future profitability as much as it reflects past results.
Union Tool’s current valuation looks demanding when lined up against the JP Machinery sector, where the average P/E sits at 13x and the peer group sits at 12.4x. The SWS fair P/E estimate of 31.2x suggests the current 30.2x level is close to what the regression-based model indicates as reasonable, yet still leaves very little room for disappointment if the forecast earnings profile or return on equity of 7.7% do not match up to what the market is currently paying for.
Explore the SWS fair ratio for Union Tool.
Result: Price-to-Earnings of 30.2x (OVERVALUED)
Still, the Union Tool story carries risk if the recently strong revenue and net income growth rates cool, or if new factories weigh on returns at a 30.2x P/E.
Find out about the key risks to this Union Tool narrative.
Another View: DCF Suggests Union Tool Is Cheap
The P/E says Union Tool looks expensive, yet the SWS DCF model paints a very different picture. At ¥14,270, the share price sits around 63.4% below an estimated fair value of ¥39,008. That gap suggests investors are paying a high multiple on today’s earnings while heavily discounting the long run cash flow profile. Which signal do you give more weight to?
Look into how the SWS DCF model arrives at its fair value.
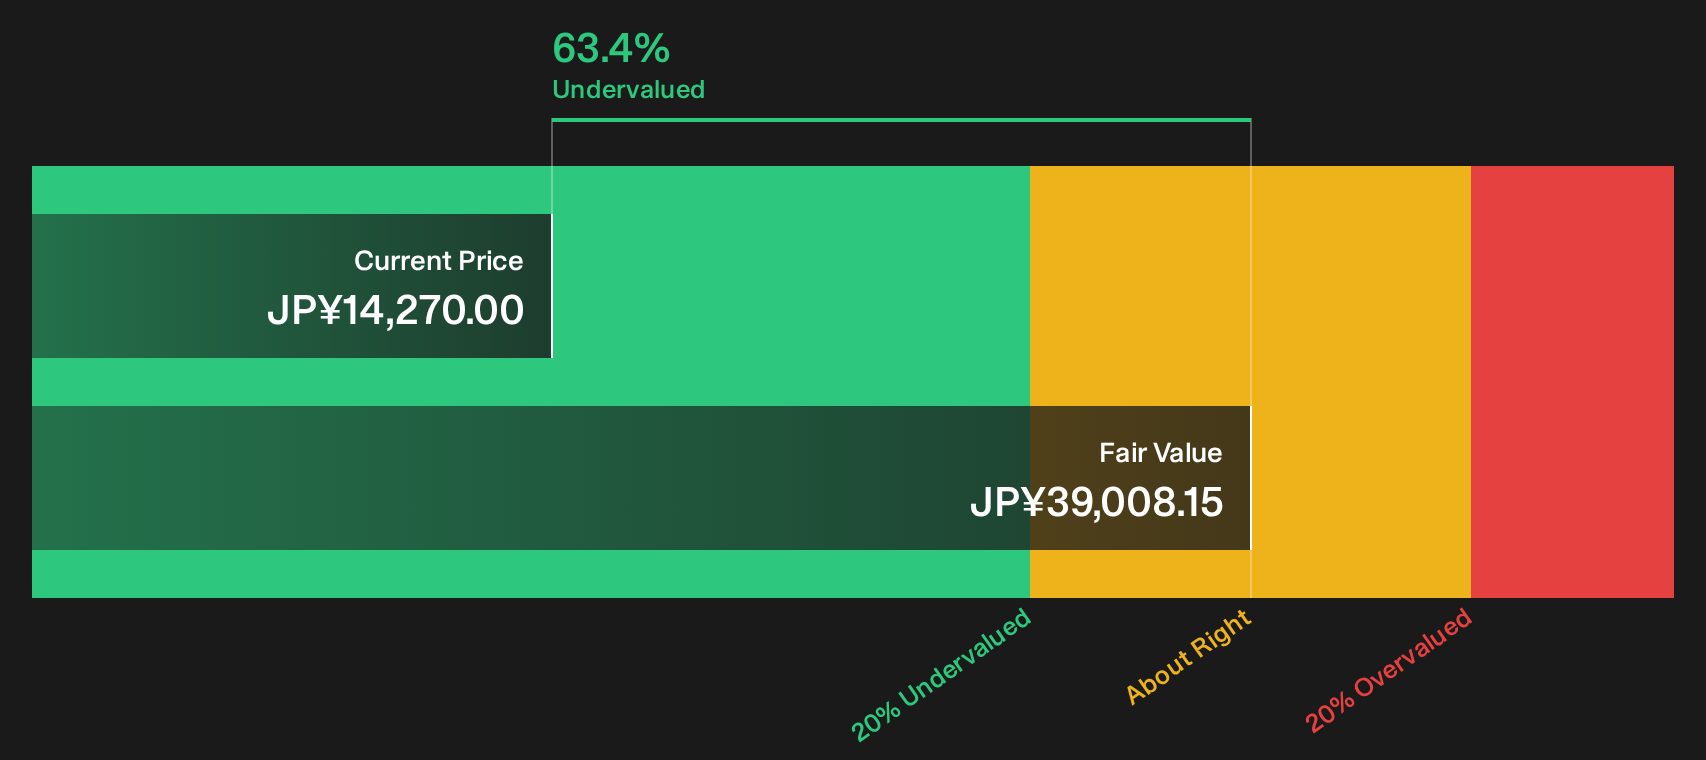
Simply Wall St performs a discounted cash flow (DCF) on every stock in the world every day (check out Union Tool for example). We show the entire calculation in full. You can track the result in your watchlist or portfolio and be alerted when this changes, or use our stock screener to discover 13 high quality undervalued stocks. If you save a screener we even alert you when new companies match - so you never miss a potential opportunity.
Next Steps
Pulling all of this together, the picture around Union Tool is finely balanced, with optimism around capacity and valuation running alongside clear questions on risk. Consider acting promptly, review both sides of the story, and weigh the 3 key rewards and 1 important warning sign for yourself.
Want More Ideas Beyond Union Tool?
Do not stop at Union Tool. Broaden your watchlist with fresh opportunities that fit different goals, from income and resilience to long term upside potential.
- Target dependable income streams by reviewing companies screened for strong yields and staying power through the 29 dividend fortresses.
- Hunt for quality at a discount with the 13 high quality undervalued stocks that surfaces businesses combining solid fundamentals with attractive pricing.
- Focus on capital preservation first by using the 22 resilient stocks with low risk scores to spot resilient stocks with lower risk profiles before others catch on.
This article by Simply Wall St is general in nature. We provide commentary based on historical data and analyst forecasts only using an unbiased methodology and our articles are not intended to be financial advice. It does not constitute a recommendation to buy or sell any stock, and does not take account of your objectives, or your financial situation. We aim to bring you long-term focused analysis driven by fundamental data. Note that our analysis may not factor in the latest price-sensitive company announcements or qualitative material. Simply Wall St has no position in any stocks mentioned.
Have feedback on this article? Concerned about the content? Get in touch with us directly. Alternatively, email editorial-team@simplywallst.com