
- PRICING
- LIVE QUOTES
- LEARN
- HELP


EN
Chiyoda (TSE:6366) Pushes Philippines Oil Storage Plans As Valuation Questions Build
Chiyoda (TSE:6366) is pushing ahead with large oil storage projects in the Philippines, supporting the country’s energy security while creating opportunities for long-term infrastructure contracts across Southeast Asia and drawing fresh attention to the stock.
Despite the Philippine oil storage contracts drawing fresh attention, recent trading has been weak, with the share price down 12.71% over the past 30 days and 26.74% year to date. At the same time, the 1 year total shareholder return of 57.47% and 3 year total shareholder return of 71.63% point to much stronger performance for investors who have held Chiyoda through earlier swings. This suggests that recent selling pressure contrasts with a still robust longer term track record.
Scan other energy infrastructure plays that could be seeing similar contract driven momentum by reviewing the hand picked 42 power grid technology and infrastructure stocks in the same region focused theme.
Recent weakness leaves Chiyoda trading well below analyst targets, even after a strong multi year run. Is the bulk of the upside still ahead, or has most of it already played out?
Price-to-Earnings of 1.9x: Is it justified?
On simple valuation math, Chiyoda screens as cheap, with a P/E of 1.9x versus both the Japanese construction sector average of 10.6x and a peer average of 13.4x. That low earnings multiple sits against a last close of ¥611 and an SWS DCF model estimate of future cash flow value at ¥1,448.87, a gap that points to a wide value spread based on current inputs.
The P/E ratio compares what investors pay for each unit of earnings, so a 1.9x reading suggests the market is assigning a relatively low price tag to Chiyoda’s current profit base. For an engineering contractor working across energy, chemicals and infrastructure, this type of metric is often used as a shorthand for how durable investors think profits are through the cycle.
There are some strong quality markers behind that low multiple. Reported earnings grew 199.9% over the past year, net profit margins improved from 6.3% to 16.7%, and return on equity is described as outstanding at 127.2%. The SWS model also flags high quality earnings and shows Chiyoda as trading 57.8% below its estimated fair value, with a fair P/E ratio of 4x that sits clearly above the current 1.9x level.
Relative comparisons are just as stark. Chiyoda is flagged as good value versus both the construction industry and its peer group, where average P/Es of 10.6x and 13.4x suggest investors are paying a much richer price for earnings elsewhere. The fair P/E estimate of 4x is more than double today’s multiple, which indicates a level the valuation could potentially move toward if market expectations on profit stability and contract visibility stabilise around the current earnings base.
Explore the SWS fair ratio for Chiyoda.
Result: Price-to-Earnings of 1.9x (UNDERVALUED)
Still, annual revenue and net income have both declined, and any further weakness in project awards or execution could challenge the bullish P/E narrative around Chiyoda.
Find out about the key risks to this Chiyoda narrative.
Another View: What The SWS DCF Model Says
Price tags built on earnings can look cheap while longer term cash flow paints a different picture. For Chiyoda, the SWS DCF model values future cash flows at ¥1,448.87 per share, well above the current ¥611 level. This also frames the stock as undervalued on this lens. If both P/E and cash flow math point the same way, the real question is how confident you are that recent earnings quality and contract wins can hold up over time.
For a closer look at how that cash flow estimate is constructed, and where the sensitivities sit, Look into how the SWS DCF model arrives at its fair value.
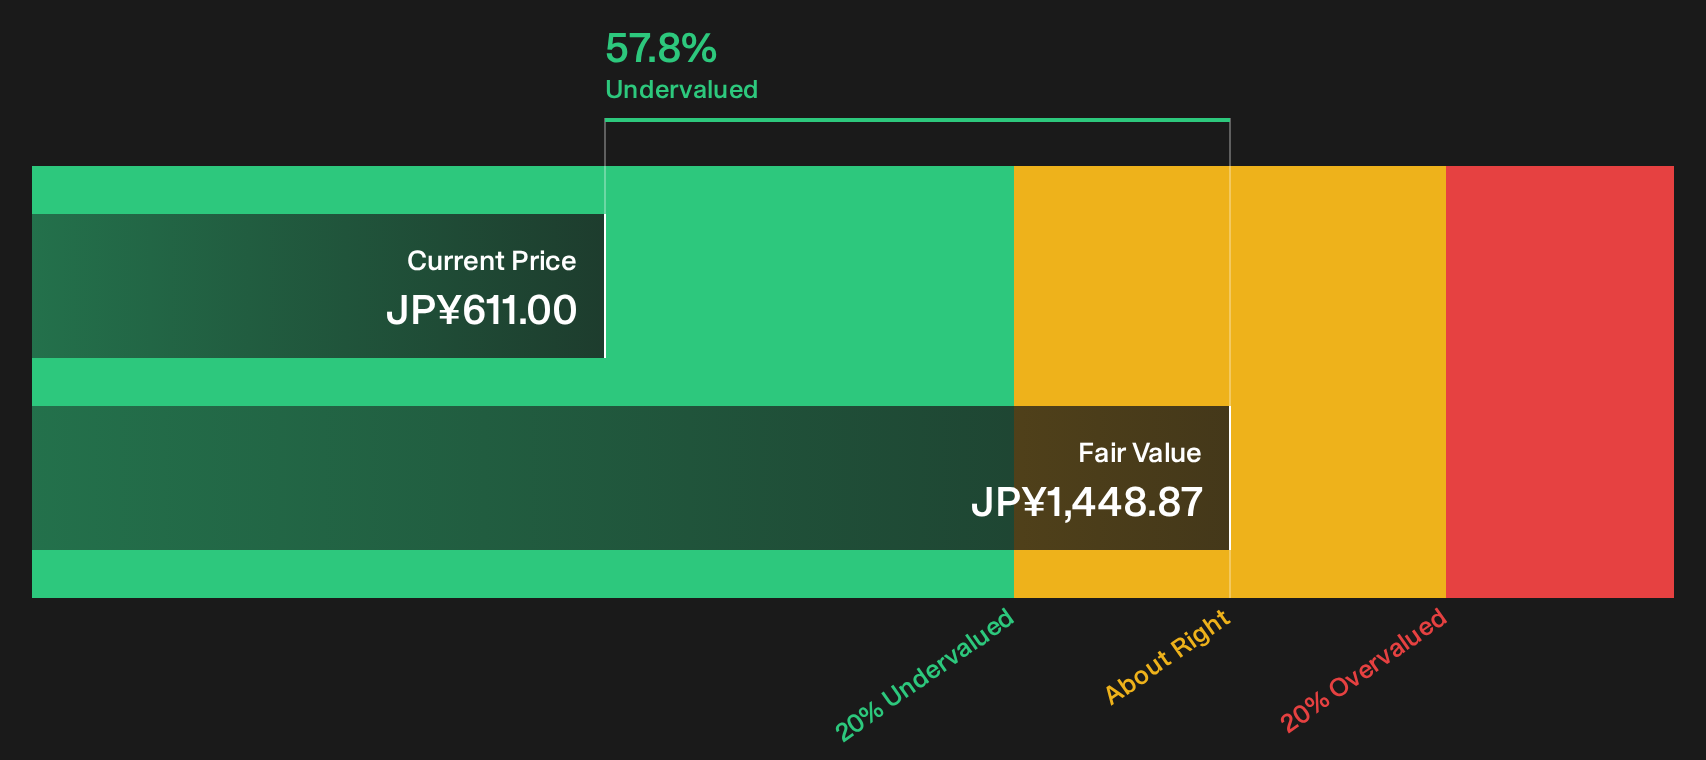
Simply Wall St performs a discounted cash flow (DCF) on every stock in the world every day (check out Chiyoda for example). We show the entire calculation in full. You can track the result in your watchlist or portfolio and be alerted when this changes, or use our stock screener to discover 13 high quality undervalued stocks. If you save a screener we even alert you when new companies match - so you never miss a potential opportunity.
Next Steps
If this combination of contract wins, valuation gaps and flagged issues around Chiyoda feels mixed, move quickly to test the data yourself. Balance both sides of the story by weighing the 3 key rewards and 2 important warning signs.
Looking for more ideas beyond Chiyoda?
If Chiyoda has sharpened your focus on value, do not stop here. Broader opportunity often appears where fresh filters surface companies you would otherwise miss.
- Target mispriced quality by scanning the 13 high quality undervalued stocks that combine strong fundamentals with prices that lag current business performance.
- Prioritise durability by reviewing the list of solid balance sheet and fundamentals (22 results) that emphasise resilient finances and cleaner balance sheets.
- Hunt for early stage potential by checking the 1 elite penny stocks with strong financials that pair low share prices with stronger financial underpinnings.
This article by Simply Wall St is general in nature. We provide commentary based on historical data and analyst forecasts only using an unbiased methodology and our articles are not intended to be financial advice. It does not constitute a recommendation to buy or sell any stock, and does not take account of your objectives, or your financial situation. We aim to bring you long-term focused analysis driven by fundamental data. Note that our analysis may not factor in the latest price-sensitive company announcements or qualitative material. Simply Wall St has no position in any stocks mentioned.
Have feedback on this article? Concerned about the content? Get in touch with us directly. Alternatively, email editorial-team@simplywallst.com