
- PRICING
- LIVE QUOTES
- LEARN
- HELP


EN
General American Investors Company (GAM) Trades At A 56% Discount, Is The Market Missing Value?
General American Investors Company (GAM) drew fresh attention after recent price moves left the stock trading at an indicated intrinsic discount of about 56%, raising questions about how its closed end fund structure is currently valued.
Recent trading has been soft, with the share price slipping around 1% over the past month and 7 days. However, General American Investors Company still shows positive momentum, with a year to date share price return of 9.08% and a 3 year total shareholder return of 104.59%, signalling that long term holders have seen materially stronger outcomes than short term traders.
Scan beyond General American Investors Company and compare its discount with a curated group of value opportunities in our 33 high quality undervalued stocks, tailored for investors hunting for mispriced assets.
A 56% discount to estimated intrinsic value grabs attention. The harder question is whether General American Investors Company is mispriced or whether the market is flagging risks that justify the gap.
Price-to-Earnings of 4.2x: Is it justified?
On a simple earnings yardstick, General American Investors Company looks inexpensive, with a P/E of 4.2x against a last close of $64.16 and a 56% discount to an internally estimated fair value.
P/E compares what investors pay for each dollar of reported profit. For an investment manager like General American Investors Company, this ratio often reflects the market's confidence in the durability of fee income, realized gains, and balance sheet gains on its portfolio.
GAM is described as good value on this measure compared with a peer average P/E of 14.5x and the wider US Capital Markets industry at 38.1x. The gap is wide, which indicates investors are either heavily discounting the quality or sustainability of earnings, or pricing in the impact of the large one off gain of $377.9m that affects the last 12 months of results.
Against that backdrop, the SWS DCF model also flags GAM at $64.16 as below an estimated future cash flow value of $145.18. This is a very large gap and reinforces that the current P/E sits far below what many listed capital markets companies trade on when earnings quality is perceived as cleaner.
See what the numbers say about this price — find out in our valuation breakdown.
Result: Price-to-Earnings of 4.2x (UNDERVALUED)
Still, the one off $377.9m gain and the closed end fund structure of General American Investors Company could skew reported earnings and keep the discount in place.
Find out about the key risks to this General American Investors Company narrative.
Another View on General American Investors Company’s Value
Price alone does not settle the argument. The SWS DCF model values General American Investors Company at an estimated future cash flow value of $145.18 per share versus the recent $64.16 trading level, which also points to the stock being undervalued on this second yardstick.
For anyone weighing how much weight to place on cash flow based signals versus earnings multiples, Look into how the SWS DCF model arrives at its fair value.
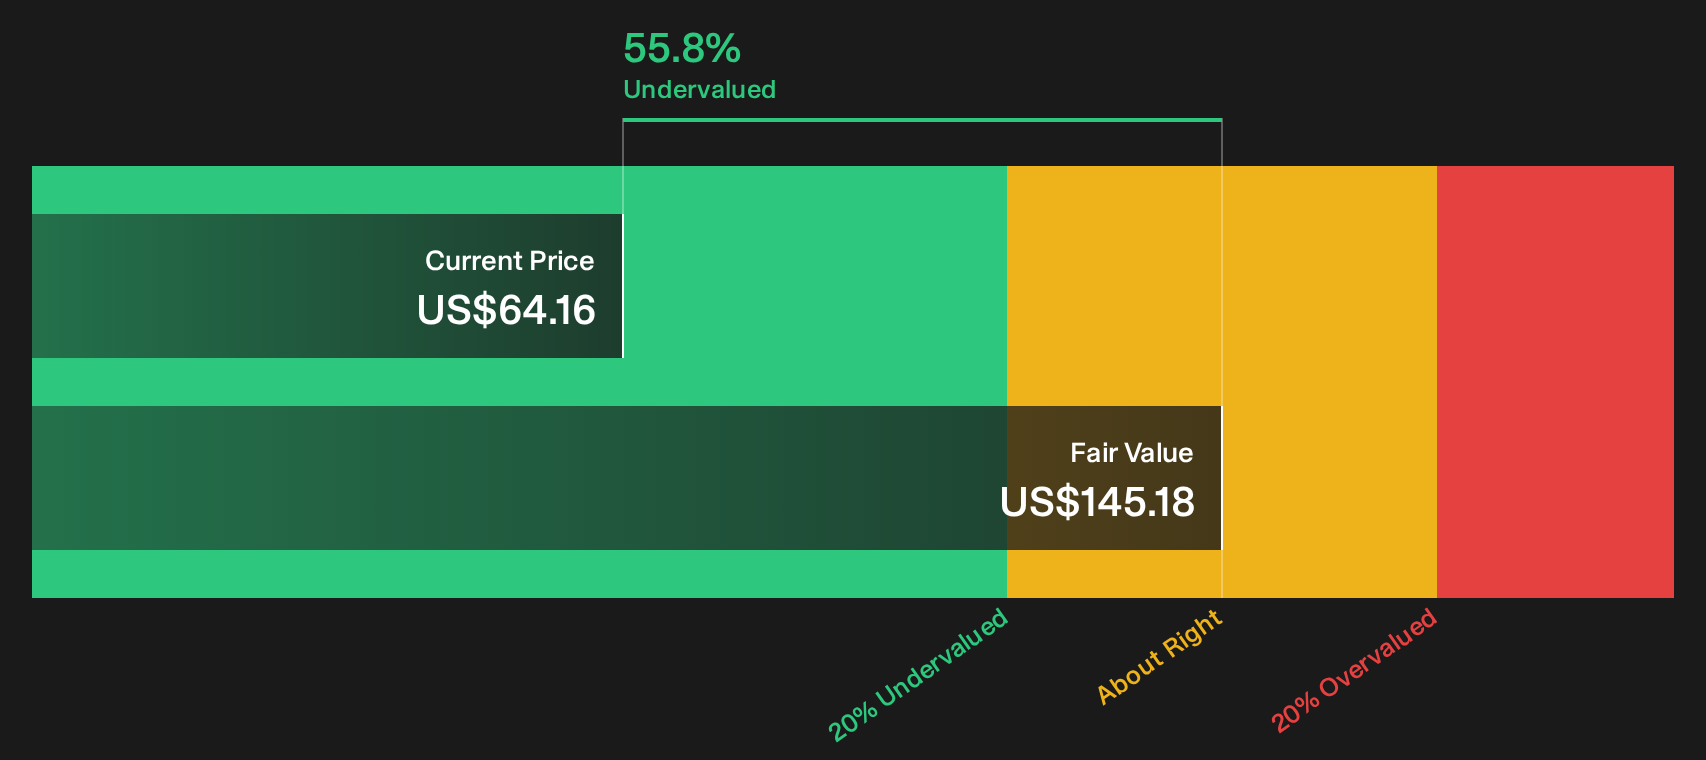
Simply Wall St performs a discounted cash flow (DCF) on every stock in the world every day (check out General American Investors Company for example). We show the entire calculation in full. You can track the result in your watchlist or portfolio and be alerted when this changes, or use our stock screener to discover 33 high quality undervalued stocks. If you save a screener we even alert you when new companies match - so you never miss a potential opportunity.
Next Steps
Mixed signals in General American Investors Company’s pricing and fundamentals only matter if you act on them. Take a few minutes to review the key figures, weigh both the concerns and the potential upside, then step back and check the 2 key rewards and 2 important warning signs
Looking for more investment ideas beyond General American Investors Company?
If General American Investors Company has sharpened your focus on value gaps, do not stop here. Broader idea generation can change your watchlist and your outcomes.
- Target higher income potential and stress test your yield expectations against a curated pool of 8 dividend fortresses that emphasise robust payouts.
- Prioritise resilience by scanning a list of solid balance sheet and fundamentals (25 results) so you can focus on businesses built to handle tougher conditions.
- Spot opportunities before the crowd by zeroing in on 20 high quality undiscovered gems that combine quality metrics with relatively low market attention.
This article by Simply Wall St is general in nature. We provide commentary based on historical data and analyst forecasts only using an unbiased methodology and our articles are not intended to be financial advice. It does not constitute a recommendation to buy or sell any stock, and does not take account of your objectives, or your financial situation. We aim to bring you long-term focused analysis driven by fundamental data. Note that our analysis may not factor in the latest price-sensitive company announcements or qualitative material. Simply Wall St has no position in any stocks mentioned.
Have feedback on this article? Concerned about the content? Get in touch with us directly. Alternatively, email editorial-team@simplywallst.com