
- PRICING
- LIVE QUOTES
- LEARN
- HELP


EN
MISUMI Group (TSE:9962) Faces A Valuation Test Following Fresh DCF Scrutiny
MISUMI Group trigger: why DCF views are in focus
Fresh discussion around discounted cash flow analysis for MISUMI Group (TSE:9962) has put attention on whether projected cash generation, margins, and earnings line up with the current share price.
Recent trading has cooled a little, with the share price down 4.1% over the past week after a 6.25% 1 month share price return. Even so, MISUMI Group still carries a 53.97% year to date share price gain and a 69.80% 1 year total shareholder return, a pattern that suggests earlier optimism is being tested as investors reassess the DCF driven valuation story.
Compare MISUMI Group's DCF story with other potential opportunities by scanning our hand picked list of 13 high quality undervalued stocks that pair cash flow support with balance sheet strength.
MISUMI Group appears to be a solid industrial platform with global reach and growing earnings, yet the share price has recently cooled following a strong run. Is this still a quality business at a quality price, or not?
Preferred P/E of 22.6x for MISUMI Group: Is it justified?
On simple earnings math, MISUMI Group looks expensive, with a P/E of 22.6x against a current share price of ¥3,857 and both peer and fair value checks pointing higher than a mid range valuation.
The P/E ratio compares what investors pay per share with the earnings that each share generates, so a higher P/E usually signals either strong profit expectations or a willingness to accept a slimmer earnings yield today. For an industrial automation platform like MISUMI Group, that often reflects investors focusing on consistency of profit, global reach, and perceived earnings quality rather than just near term fluctuations.
Here, the market is assigning a P/E of 22.6x, which is above the Machinery industry average of 13x and also above the estimated fair P/E of 20.9x. That gap implies investors are paying a premium compared to both sector peers and the level our fair ratio suggests the valuation could move toward if enthusiasm and fundamentals were more closely aligned.
Explore the SWS fair ratio for MISUMI Group.
Result: Price-to-earnings of 22.6x (OVERVALUED).
Still, a premium P/E for MISUMI Group could be pressured if revenue growth slows from the current 9.3% pace or if earnings momentum at 12.4% stalls.
Find out about the key risks to this MISUMI Group narrative.
Another view on MISUMI Group's value
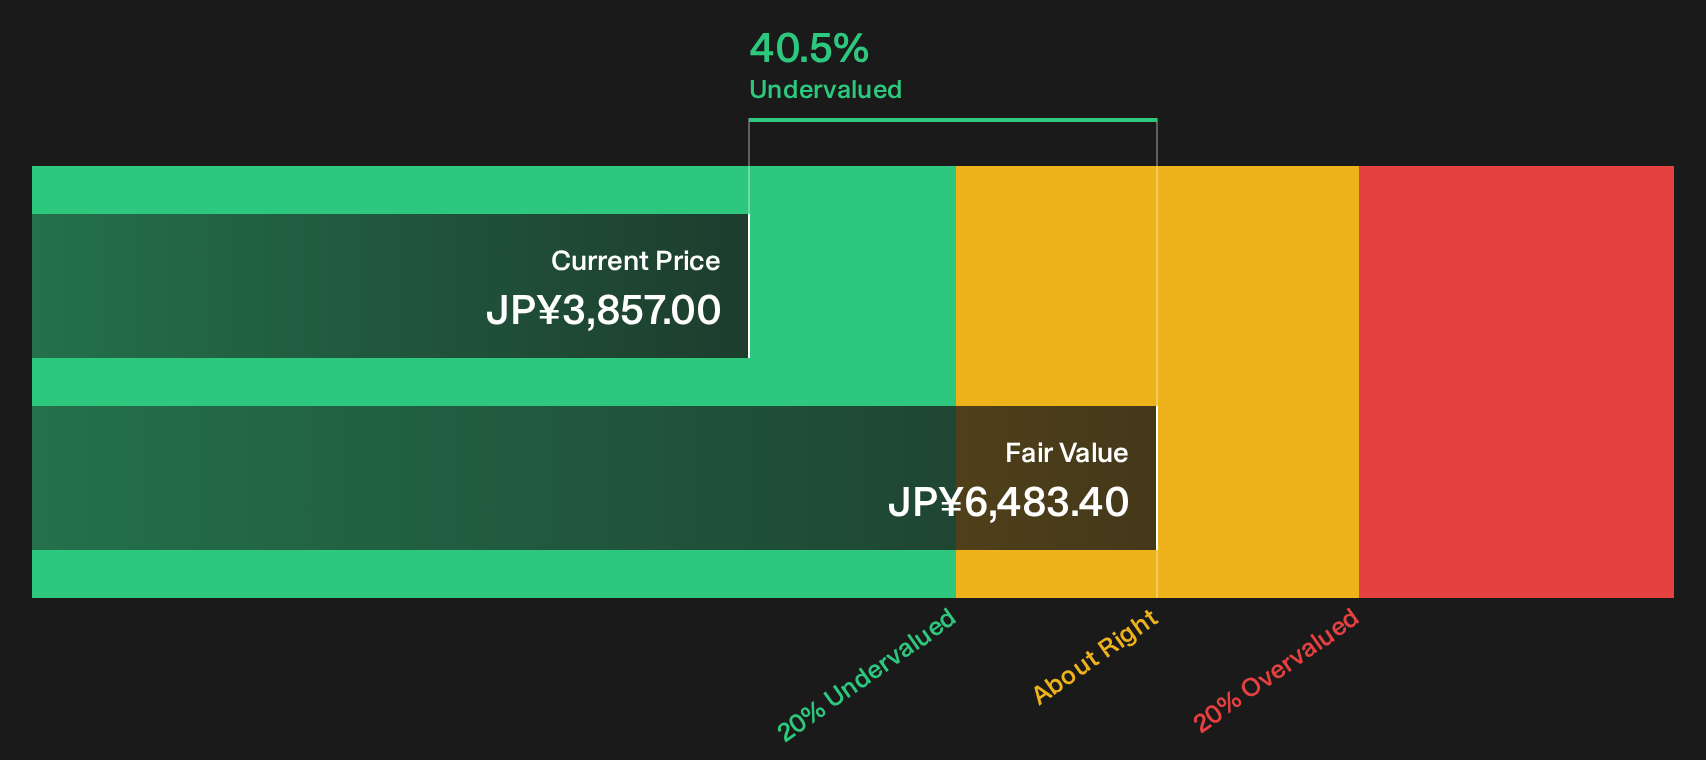
The earnings multiple paints MISUMI Group as expensive, yet the SWS DCF model points a different way. On that cash flow view, the share price of ¥3,857 sits about 40.5% below an estimated future cash flow value of ¥6,483.4, which frames MISUMI Group as undervalued instead.
That kind of gap between a P/E premium and an implied discount on projected cash generation can signal either a cautious market or optimistic model inputs. Which side do you think has it right at this point in the cycle for MISUMI Group?
Look into how the SWS DCF model arrives at its fair value.
Simply Wall St performs a discounted cash flow (DCF) on every stock in the world every day (check out MISUMI Group for example). We show the entire calculation in full. You can track the result in your watchlist or portfolio and be alerted when this changes, or use our stock screener to discover 13 high quality undervalued stocks. If you save a screener we even alert you when new companies match - so you never miss a potential opportunity.
Next Steps
If this mix of premium P/E and discounted DCF leaves you undecided, go directly to the source material and evaluate the full picture in detail. To consider both sides of the MISUMI Group story, start by reviewing the 3 key rewards and 1 important warning sign.
Looking for more investment ideas beyond MISUMI Group?
Do not stop with MISUMI Group. Broaden your watchlist now with focused stock ideas built from the same data driven process that underpins this valuation work.
- Target reliable compounding by zeroing in on resilient dividend payers through the 29 dividend fortresses that filters for higher yield and stability.
- Hunt for quality at a reduced price by scanning the 13 high quality undervalued stocks that highlights strong fundamentals paired with supportive valuations.
- Spot under the radar opportunities before the crowd by checking the 73 high quality undiscovered gems built to surface high quality businesses that screens rarely highlight.
This article by Simply Wall St is general in nature. We provide commentary based on historical data and analyst forecasts only using an unbiased methodology and our articles are not intended to be financial advice. It does not constitute a recommendation to buy or sell any stock, and does not take account of your objectives, or your financial situation. We aim to bring you long-term focused analysis driven by fundamental data. Note that our analysis may not factor in the latest price-sensitive company announcements or qualitative material. Simply Wall St has no position in any stocks mentioned.
Have feedback on this article? Concerned about the content? Get in touch with us directly. Alternatively, email editorial-team@simplywallst.com