
- PRICING
- LIVE QUOTES
- LEARN
- HELP


EN
Air China (SEHK:753) Reports September Traffic Data, Is The Stock A Bargain?
Air China (SEHK:753) just released detailed operating statistics for September 2026 and the year to date, giving investors fresh data on passenger volumes, cargo activity, capacity, and load factors across its network.
Against that fresh set of operating figures, Air China’s shares closed at HK$3.505 after a 1-day share price return of 1.30%, although the stock has fallen 50.70% on a year to date share price basis and recorded a 40.39% decline in 1-year total shareholder return, which points to weak longer term momentum despite the latest update.
Scan how Air China’s latest traffic data compares with other carriers by reviewing a curated set of list of solid balance sheet and fundamentals (203 results) that may offer a different mix of resilience and potential recovery.
Air China’s latest traffic figures gave traders something concrete to react to, yet the share price still reflects a long slide in sentiment. Is this move tied to fundamentals, or just a brief shift in mood before valuation work begins?
Preferred Multiple of 0.3x P/S: Is it justified?
On simple sales-based metrics, Air China looks cheap. The stock last closed at HK$3.505, while the business is described as trading on a P/S of 0.3x that is framed as good value versus both peers and the wider Asian Airlines group.
P/S compares the company’s market value to its annual revenue and is often used when a carrier is unprofitable, as is the case here with Air China reporting a loss of CN¥2,250.607. For airlines, this ratio helps you judge what investors are willing to pay today for each unit of ticket and cargo income, regardless of where net profit sits in the cycle.
Against that backdrop, Air China is flagged as good value relative to peers at a P/S of 0.3x compared with a peer average of 1.9x. It is also described as cheap relative to the Asian Airlines industry average of 0.6x, and the estimated fair P/S ratio of 0.8x suggests a level that sentiment could plausibly move toward if the market re-rates the stock.
Explore the SWS fair ratio for Air China.
Result: Price-to-sales of 0.3x (UNDERVALUED)
Still, the heavy total shareholder return declines over 1 and 5 years, along with the recent net loss of CN¥2,250.607, keep Air China’s low P/S story exposed.
Find out about the key risks to this Air China narrative.
Another View: What the SWS DCF Model Says About Air China
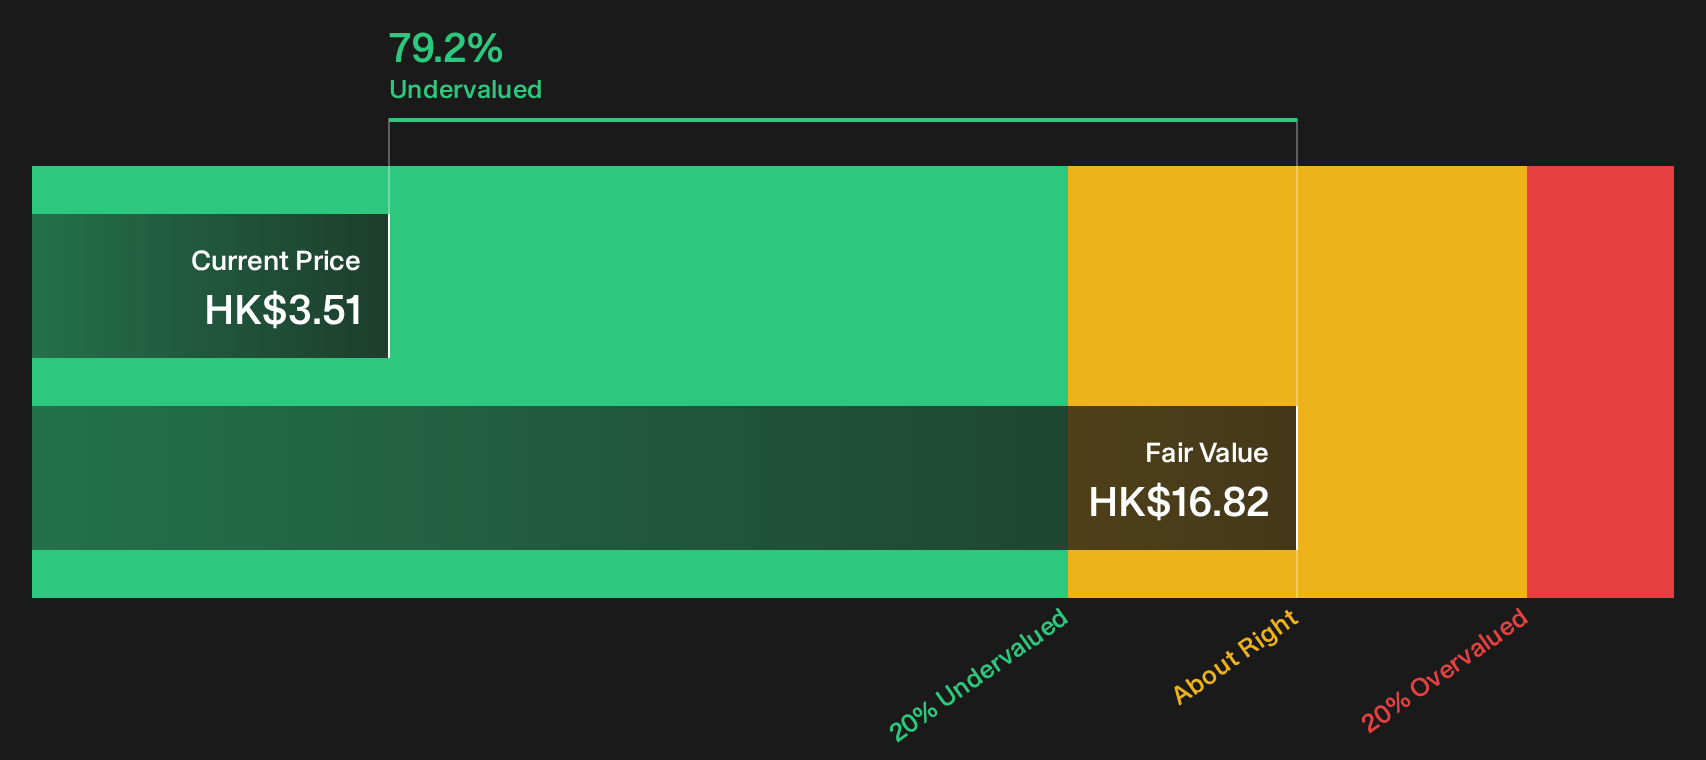
The sales multiple paints Air China as cheap, yet the SWS DCF model goes much further. At HK$3.51, the share price sits well below an estimated future cash flow value of HK$16.82, which frames the stock as deeply undervalued rather than just modestly mispriced.
That gap suggests either the model is too optimistic about future cash generation, or the market is heavily discounting execution risks, balance sheet pressure, and sector uncertainty. Which side you trust more comes down to how confident you are in Air China’s ability to turn forecast cash flows into reality.
Look into how the SWS DCF model arrives at its fair value.
Simply Wall St performs a discounted cash flow (DCF) on every stock in the world every day (check out Air China for example). We show the entire calculation in full. You can track the result in your watchlist or portfolio and be alerted when this changes, or use our stock screener to discover 189 high quality undervalued stocks. If you save a screener we even alert you when new companies match - so you never miss a potential opportunity.
Next Steps
Sentiment in this review of Air China has been mixed. Consider acting promptly, review the figures, and weigh the downside and upside for yourself with 3 key rewards and 1 important warning sign
Looking for more investment ideas beyond Air China?
If Air China has you rethinking your watchlist, do not stop here. Fresh ideas often come from comparing very different businesses side by side.
- Target dependable balance sheets and steadier fundamentals by scanning a curated list of solid balance sheet and fundamentals (203 results) that could complement higher risk positions.
- Hunt for quality at a discount by reviewing 189 high quality undervalued stocks that pair stronger cash profiles with what may be more modest expectations.
- Build a portfolio with income in mind by checking 215 dividend fortresses that combine 5%+ yields with a focus on resilience.
This article by Simply Wall St is general in nature. We provide commentary based on historical data and analyst forecasts only using an unbiased methodology and our articles are not intended to be financial advice. It does not constitute a recommendation to buy or sell any stock, and does not take account of your objectives, or your financial situation. We aim to bring you long-term focused analysis driven by fundamental data. Note that our analysis may not factor in the latest price-sensitive company announcements or qualitative material. Simply Wall St has no position in any stocks mentioned.
Have feedback on this article? Concerned about the content? Get in touch with us directly. Alternatively, email editorial-team@simplywallst.com