
- PRICING
- LIVE QUOTES
- LEARN
- HELP


EN
Learn Why The Bull Case For Tryg (CPSE:TRYG) Could Change Following Higher Q3 Net Income
- Tryg A/S reported third quarter 2026 net income of DKK 1,625 million, up from DKK 1,479 million a year earlier, with basic earnings per share from continuing operations at DKK 2.68.
- Over the first nine months of 2026, Tryg recorded net income of DKK 3,457 million and is linking operational improvements, digitalisation and partnerships to its profitability goals for 2027.
- We will now look at how Tryg's higher third quarter net income reshapes the investment narrative built around efficiency and underwriting.
Scan how Tryg's efficiency story compares with other insurers by reviewing 232 resilient stocks with low risk scores, which aims to pair resilient balance sheets with more controlled risk profiles.
Tryg Investment Narrative Recap
To own Tryg, you need to believe the insurer can keep turning its efficiency work into a steadier underwriting result while holding customer churn in check. The higher third quarter 2026 net income of DKK 1,625 million and basic EPS of DKK 2.68 support that story, but the nine month figures remind you that progress is not linear.
The key short term swing factor remains execution on claims efficiency and pricing, especially in Norway and private lines, while avoiding the loss of too many policyholders as price led gains fade. Inflation, competitive churn and potential Danish regulatory changes around indexation remain the biggest operational risk, and this earnings print does not remove that.
The latest quarterly earnings announcement is the clearest reference point for those catalysts. Third quarter net income of DKK 1,625 million, up from DKK 1,479 million a year earlier, together with sequential underlying claims ratio improvements through 2026, highlights the operational programmes Tryg refers to when it reaffirms its 2027 insurance service result and combined ratio ambitions.
Across the first nine months, net income of DKK 3,457 million compared with DKK 4,128 million a year earlier keeps the focus on execution risk. Investors will want to see whether digitalisation, straight through processing of around 220,000 claims in Q3 2026 and new partnerships can offset pricing and regulatory pressure enough for Tryg to stay on track toward its 2027 targets.
What The Tryg Consensus Is Building In
Analysts sketch a Tryg roadmap that leans on modest top line expansion and fatter profit margins rather than aggressive volume growth. The current set of forecasts points to revenue growth of 1.8% each year over the next three years, with profit margins moving from 10.6% today to 13.2% over the same period as efficiency gains bed in.
Earnings expectations sit at DKK 4.6b today and DKK 6.1b by around 2029, with some analysts projecting as much as DKK 6.9b. That implies an earnings increase of roughly DKK 1.5b on the consensus view, alongside a slow reduction in the share count of about 1.09% per year. The price targets effectively assume investors are comfortable with a P/E that moves from 19.2x today to 18.5x on those 2029 earnings. This is still below the current 22.1x for the wider GB insurance peer group.
Tryg's narrative projects DKK 46.1b revenue and DKK 6.1b earnings by 2029. This rests on 1.8% yearly revenue growth and an earnings increase of about DKK 1.5b from DKK 4.6b today.
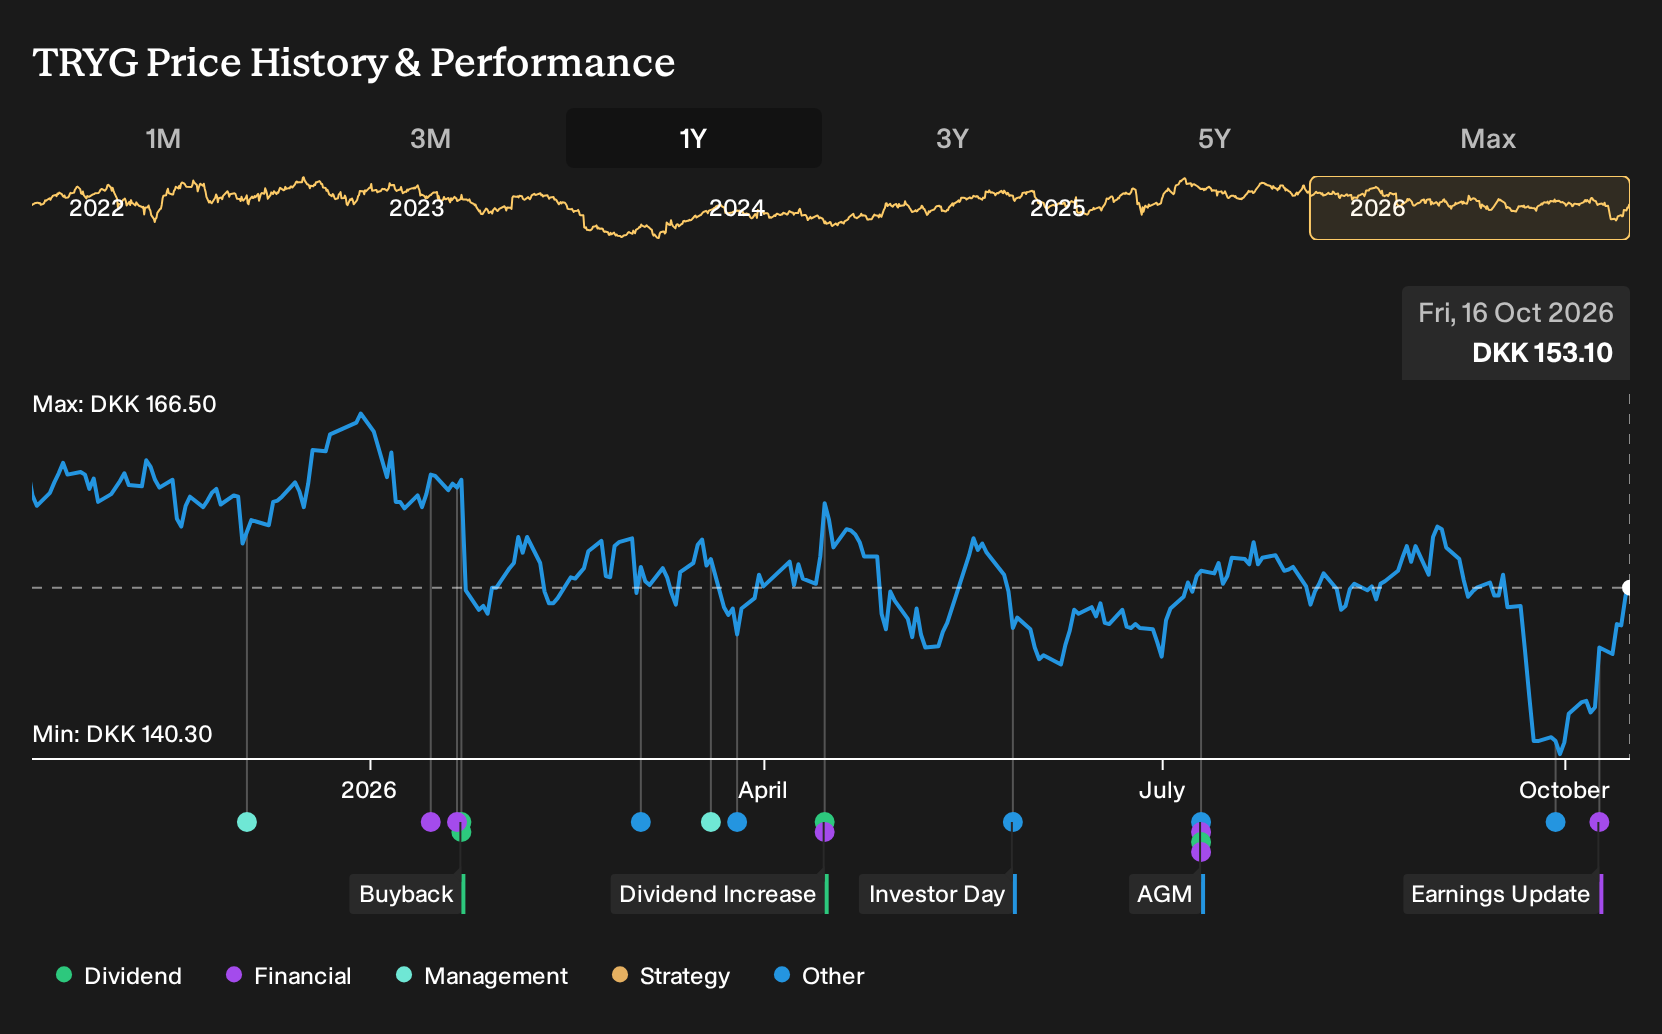
On valuation, the market is being asked to weigh a current share price of DKK 149.7 against a consensus target of DKK 165.67, with the most optimistic analysts at DKK 192.0 and the most cautious at DKK 140.0. These reference points all hinge on the same spine of assumptions, that steady digitalisation, claims automation and tight underwriting are enough to justify 2029 revenues of DKK 46.1b and earnings of DKK 6.1b under a 5.5% discount rate. For any investor watching Tryg, the real task is to test whether those inputs feel conservative, aggressive or simply reasonable given personal expectations for pricing, regulation and churn over the next few years.
Uncover why Tryg's fair value indicates an 8% potential upside to its current price that could narrow quickly.
Exploring Other Perspectives
Three fair value views from the Simply Wall St Community cluster between DKK 165.67 and DKK 252.69, so some private investors see Tryg as only modestly mispriced while others envisage a far richer outcome. You should weigh those gaps against inflation, churn and Danish regulatory risks, and then explore how your own expectations compare.
Explore 2 other Tryg fair value estimates, including one that suggests as much as 65% potential increase from the current price!
The Verdict Is Yours
Don't just follow the ticker. Dig into the data and build a conviction that's truly your own.
- A great starting point for your Tryg research is our analysis highlighting 2 key rewards and 1 important warning sign that could impact your investment decision.
- See our latest analysis for Tryg. The report includes a comprehensive fundamental analysis summarized in a single visual, the Snowflake, making it easy to evaluate Tryg's overall financial health at a glance.
Looking for more investment ideas beyond Tryg?
Once you have a view on Tryg, it can help to widen the lens and compare it with other companies that line up with your risk tolerance and return goals. The Simply Wall St Screener lets you do exactly that by filtering for balance sheet strength, valuation and income potential in just a few clicks.
- If capital preservation comes first for you, start with a curated 232 resilient stocks with low risk scores that aims to highlight businesses with steadier financial profiles and less volatile risk scores.
- If value is your focus, scan the 189 high quality undervalued stocks to find candidates where quality fundamentals and pricing appear out of sync.
- If income streams matter most, review a targeted 215 dividend fortresses to see companies combining higher yields with resilience in their payout history.
This article by Simply Wall St is general in nature. We provide commentary based on historical data and analyst forecasts only using an unbiased methodology and our articles are not intended to be financial advice. It does not constitute a recommendation to buy or sell any stock, and does not take account of your objectives, or your financial situation. We aim to bring you long-term focused analysis driven by fundamental data. Note that our analysis may not factor in the latest price-sensitive company announcements or qualitative material. Simply Wall St has no position in any stocks mentioned.
Have feedback on this article? Concerned about the content? Get in touch with us directly. Alternatively, email editorial-team@simplywallst.com