
- PRICING
- LIVE QUOTES
- LEARN
- HELP


EN
How Investors Are Reacting To Bank of New York Mellon Corporation Raised Earnings Outlook
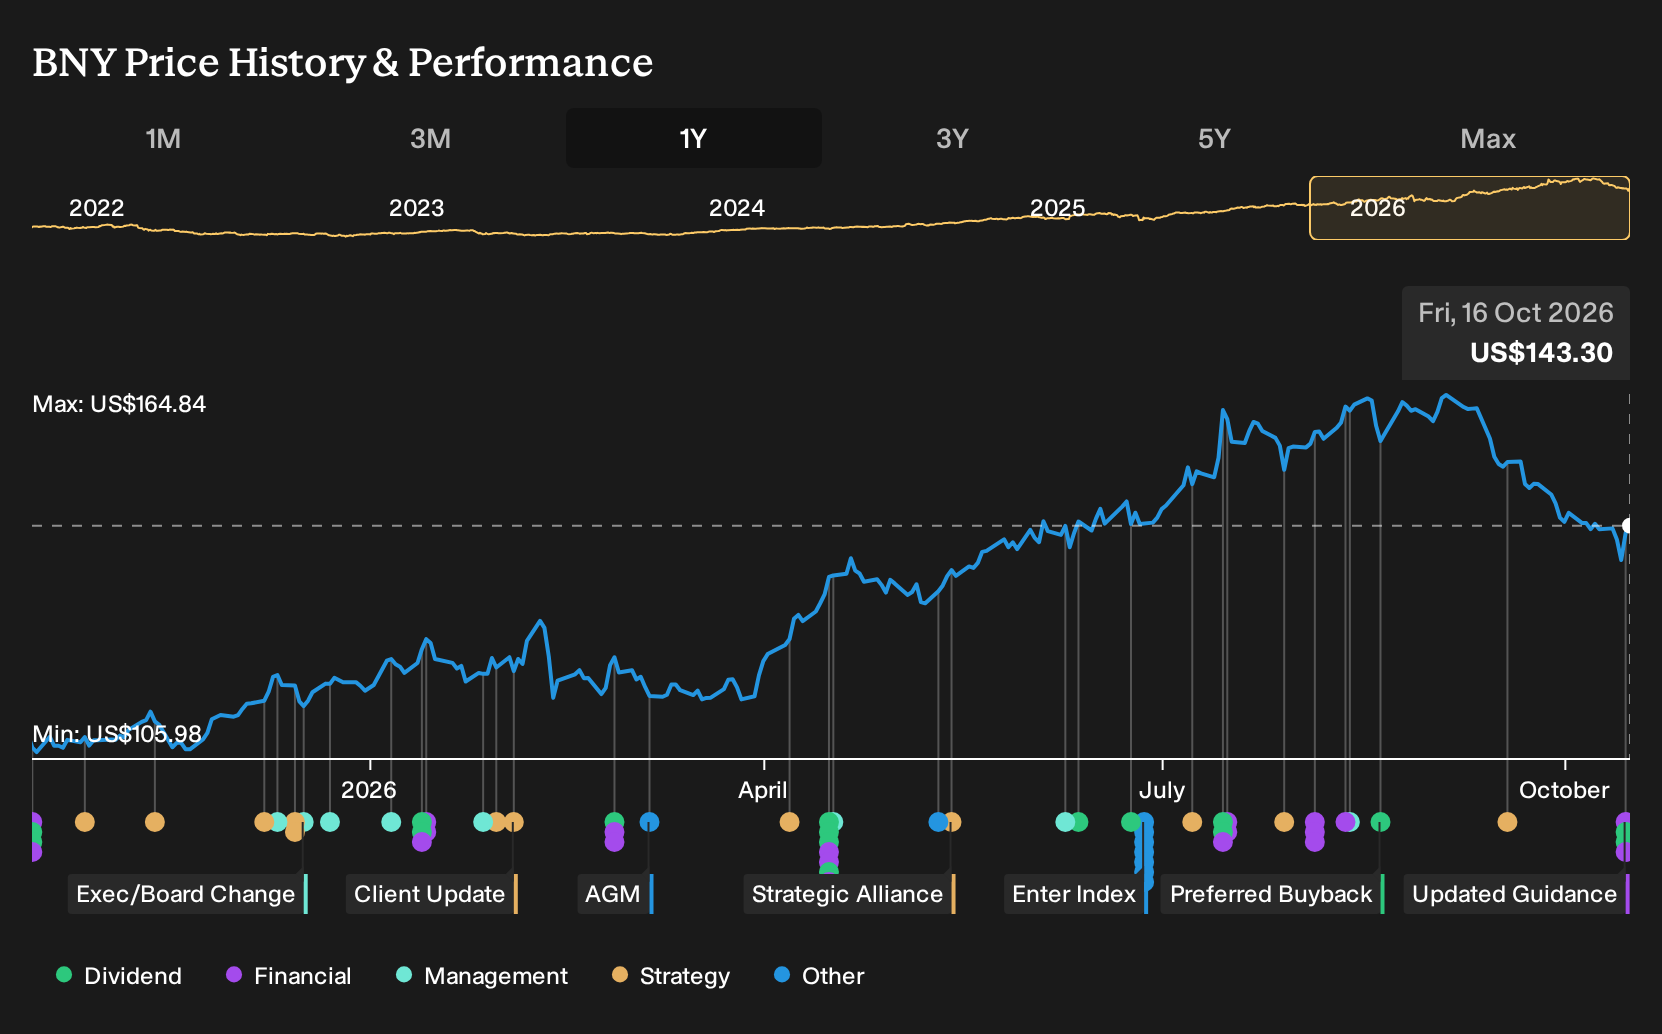
- Bank of New York Mellon Corporation reported third quarter 2026 net income of US$1,690 million with diluted EPS from continuing operations of US$2.34. The company raised full year 2026 net interest income guidance to 15% year over year, affirmed a US$0.63 common dividend, declared a series of preferred dividends, and completed a US$1,225.83 million buyback.
- BNY paired higher earnings and updated net interest income expectations with progress on tokenized money market funds using distributed ledger networks, which ties fee based servicing strength to new digital asset infrastructure.
- We will look at how BNY's investment narrative is affected by the stronger earnings guidance and net interest income outlook.
Scan how other banks and fee driven financials compare with Bank of New York Mellon Corporation in terms of EPS, dividend payments, and capital returns by reviewing the curated list of solid balance sheet and fundamentals (25 results).
Bank of New York Mellon Investment Narrative Recap
To own Bank of New York Mellon Corporation you need to believe its fee heavy custody and servicing engine, now supported by higher net interest income guidance of 15% year over year, can keep pulling earnings higher without letting costs creep. The near term swing factor is execution on this operating leverage story as the platform model scales.
The biggest risk sits in fee pressure or weaker flows that chip away at that stable servicing narrative just as spending on technology and digital assets ramps. If expense growth starts to outpace revenue or digital projects fail to translate into usable products, the current efficiency gains could lose momentum.
The recent common and preferred dividend declarations appear most relevant here because they sit alongside share buybacks and rising earnings per share. When a bank commits cash to distributions, it is effectively indicating that current capital generation and risk appetite are aligned with its operating message.
For BNY, those payouts link directly to the same catalysts investors are watching: sustained fee income, higher net interest revenue, and disciplined costs. Any hit to custody or investment management fees, or any slippage in operating leverage, would tighten the room for dividends and repurchases and could test how durable this capital return profile is.
Bank of New York Mellon Corporation's current analyst narrative points to revenues of US$24.4 billion and earnings of US$7.4 billion by 2029, based on an assumed 4.5% yearly increase in revenue and a move in earnings from US$6.0 billion today to that US$7.4 billion level, which is an earnings gain of about US$1.4 billion over the period.
Uncover why Bank of New York Mellon's fair value indicates a 14% potential upside to its current price that could narrow quickly.
Exploring Other Perspectives
Fair value estimates for Bank of New York Mellon Corporation from 2 members of the Simply Wall St Community span roughly US$134 to US$163 per share, which is a wide band for such a small sample. Those views all pre date the higher 2026 net interest income guidance and fresh capital returns, so you are comparing older forecasts with a business that is now signaling different earnings drivers.
Explore another Bank of New York Mellon fair value estimate, including one that indicates there could be as much as 7% downside from the current price.
Reach Your Own Conclusion
Don't just follow the ticker. Dig into the data and build a conviction that's truly your own.
- A great starting point for your Bank of New York Mellon research is our analysis highlighting 4 key rewards and 1 important warning sign that could impact your investment decision.
- See our latest analysis for Bank of New York Mellon. The report includes a comprehensive fundamental analysis summarized in a single visual, the Snowflake, making it easy to evaluate Bank of New York Mellon Corporation's overall financial health at a glance.
Looking For More Investment Ideas Beyond Bank of New York Mellon Corporation?
If you want to stress test your view on Bank of New York Mellon Corporation, set it alongside a broader watchlist of peers. The Simply Wall St Screener can help you scan for other stocks that match the income profile, balance sheet strength, or valuation style you care about most.
- For investors who want income to play a central role in total return, you can review high yield candidates through the 8 dividend fortresses that might complement a position in Bank of New York Mellon Corporation.
- If capital preservation and steadier risk profiles matter more to you than pursuing the highest potential gains, you can filter for defensively positioned businesses with the 32 resilient stocks with low risk scores that can sit alongside BNY in a more balanced portfolio.
- When you want growth potential supported by solid fundamentals rather than short-term attention, you can broaden your research with the 20 high quality undiscovered gems that could sit on your radar before they attract wider interest.
This article by Simply Wall St is general in nature. We provide commentary based on historical data and analyst forecasts only using an unbiased methodology and our articles are not intended to be financial advice. It does not constitute a recommendation to buy or sell any stock, and does not take account of your objectives, or your financial situation. We aim to bring you long-term focused analysis driven by fundamental data. Note that our analysis may not factor in the latest price-sensitive company announcements or qualitative material. Simply Wall St has no position in any stocks mentioned.
Have feedback on this article? Concerned about the content? Get in touch with us directly. Alternatively, email editorial-team@simplywallst.com