
- PRICING
- LIVE QUOTES
- LEARN
- HELP


EN
First National Bank Alaska (FBAK) Could Be 29% Undervalued On Planned CEO Succession
First National Bank Alaska (FBAK) announced a leadership reshuffle, with longtime CEO and President Betsy Lawer set to become Executive Chair and Darren Franz stepping into both top executive roles.
Recent trading has cooled a little, with the share price down 3.9% over the past month to US$317.01. However, the year-to-date share price return of 7.8% and 1-year total shareholder return of 24.1% suggest that momentum over a longer stretch has still been positive.
Spot 32 resilient stocks with low risk scores that, like First National Bank Alaska, put stability, succession planning, and balance-sheet resilience at the center of their story.First National Bank Alaska has a reputation for stability and long-planned leadership handovers, and the stock has reflected that over longer periods. After the recent pullback, is that resilience already fully priced in or not?
First National Bank Alaska earnings, returns and what the market is paying for them
First National Bank Alaska has been rewarding long term holders, with a 3 year total shareholder return of 112.7% and a 5 year return of 90.6%. Those outcomes came alongside earnings that have grown by 8% a year over the past 5 years, and 12.7% over the most recent year.
Profitability is robust. Net profit margin currently sits at 37.1%, compared with 36.2% last year. Return on equity is 14.3%, which the data classifies as low compared with a 20% threshold, yet it still reflects a solid ability to turn equity into earnings for a regulated bank.
The share price move has outpaced both the broader US market and the US Banks industry over the past 12 months. First National Bank Alaska delivered a 1 year total shareholder return of 24.1%, versus 11.8% for the overall US market and 13.4% for US banks. That gap matters because it suggests investors have been willing to pay up for the bank’s earnings and balance sheet profile.
Preferred P/E multiple of 12x for First National Bank Alaska: Is it justified?
On valuation, First National Bank Alaska trades on a P/E of 12x, which is slightly richer than both its peer group on 11.6x and the wider US Banks industry on 11.5x. The share price of $317.01 therefore reflects a modest premium to similar lenders based on current earnings.
The P/E ratio compares the equity price with the profits attributable to each share. For a regional bank like this one, investors often watch P/E because it condenses a lot of moving parts, such as credit costs, loan growth and funding costs, into a single yardstick. A higher P/E typically signals that the market is willing to pay more today for each dollar of current earnings, which can reflect perceived quality or consistency of those profits.
Here, the premium sits alongside data points that show earnings have grown 8% per year over 5 years, with growth over the most recent year running ahead of that average at 12.7%. The business is also assessed as having high quality earnings, and the SWS DCF model suggests the shares are trading at a 29.3% discount to an estimated future cash flow value of $448.44. That mix of a slightly higher P/E, solid profitability and an indicated gap to a DCF value paints a more nuanced picture than the headline multiple alone.
The comparison with the sector is clear. First National Bank Alaska is described as expensive against both its specific peer average P/E of 11.6x and the broader US Banks group on 11.5x. That means investors are paying more than they would for the typical bank in the industry for each unit of current earnings, even though the DCF framework points to the stock trading below an internally assessed fair value based on future cash flows.
See what the numbers say about this price — find out in our valuation breakdown.
Result: Price-to-earnings of 12x (OVERVALUED)
Still, the story for First National Bank Alaska could change quickly if credit quality weakens or if economic conditions in Alaska reduce loan demand and fee income.
Find out about the key risks to this First National Bank Alaska narrative.
Another view on First National Bank Alaska’s value
A different lens tells a different story. The SWS DCF model values First National Bank Alaska at $448.44 a share, which is above the current price of $317.01. That points to the stock trading at a 29.3% discount and raises a question. Is the market underpricing those future cash flows or seeing risks that the model cannot capture?
Look into how the SWS DCF model arrives at its fair value.
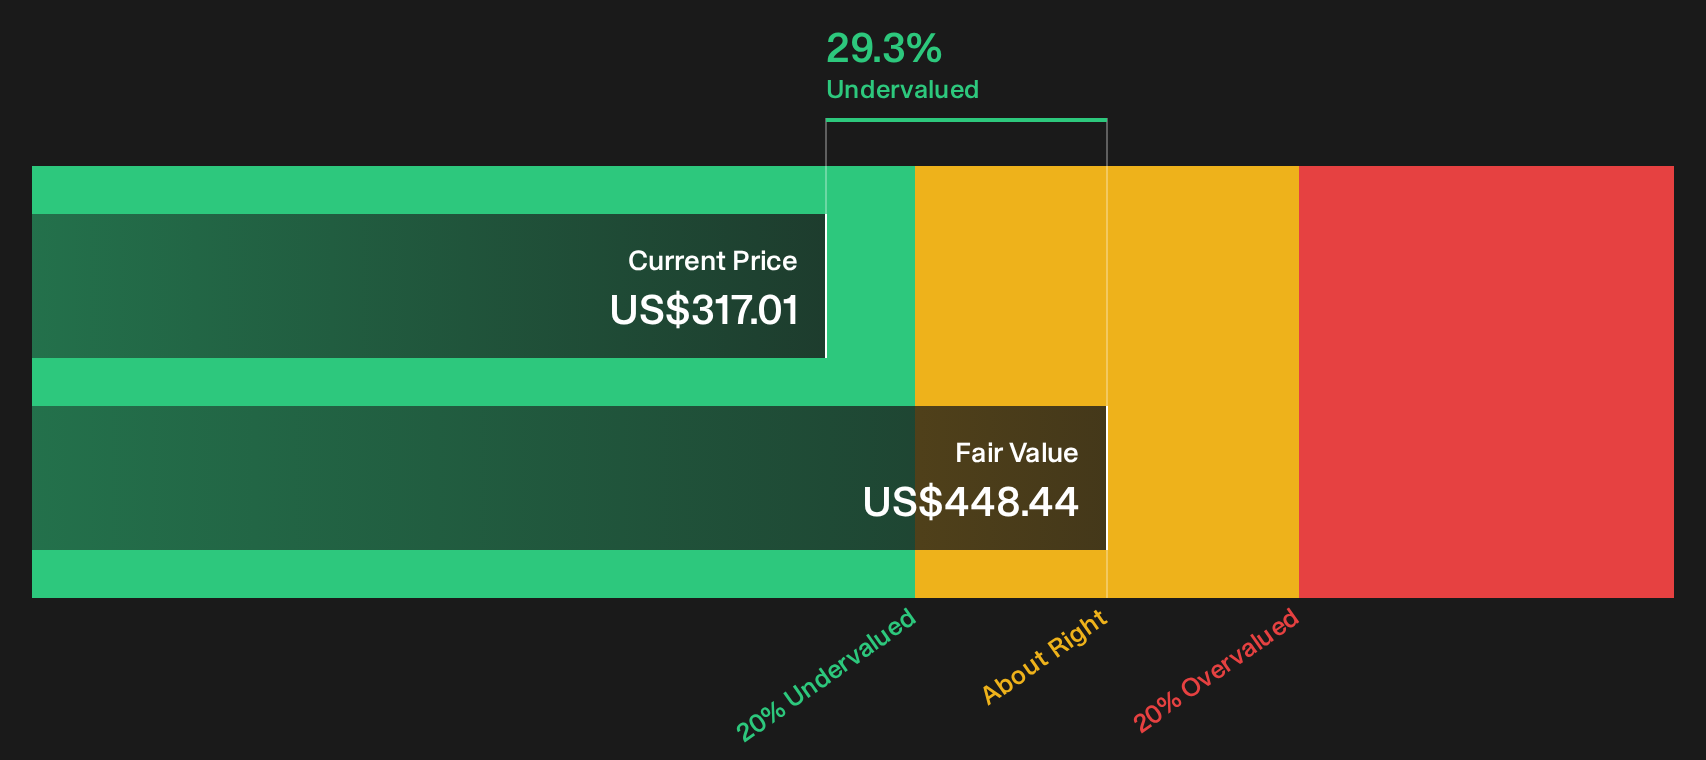
Simply Wall St performs a discounted cash flow (DCF) on every stock in the world every day (check out First National Bank Alaska for example). We show the entire calculation in full. You can track the result in your watchlist or portfolio and be alerted when this changes, or use our stock screener to discover 33 high quality undervalued stocks. If you save a screener we even alert you when new companies match - so you never miss a potential opportunity.
Next Steps
Mixed signals in the First National Bank Alaska story so far. Take a closer look at the full picture, including both the upside potential and the concerns, and weigh them for yourself with 2 key rewards and 1 important warning sign
Looking for more investment ideas beyond First National Bank Alaska?
If First National Bank Alaska is on the radar, do not stop here. A broader watchlist built from disciplined filters can sharpen decisions and surface alternatives.
- Target resilient balance sheets and steady fundamentals by scanning the list of solid balance sheet and fundamentals (25 results) that already clear strict financial health checks.
- Hunt for mispriced opportunities where quality and value intersect by running through the 33 high quality undervalued stocks before the crowd catches up.
- Prioritize potential income and staying power by reviewing the 8 dividend fortresses that pair higher yields with robust underlying businesses.
This article by Simply Wall St is general in nature. We provide commentary based on historical data and analyst forecasts only using an unbiased methodology and our articles are not intended to be financial advice. It does not constitute a recommendation to buy or sell any stock, and does not take account of your objectives, or your financial situation. We aim to bring you long-term focused analysis driven by fundamental data. Note that our analysis may not factor in the latest price-sensitive company announcements or qualitative material. Simply Wall St has no position in any stocks mentioned.
Have feedback on this article? Concerned about the content? Get in touch with us directly. Alternatively, email editorial-team@simplywallst.com