
- PRICING
- LIVE QUOTES
- LEARN
- HELP


EN
Money Forward (TSE:3994) Turns Profitable On Fresh Questions Over Valuation
Money Forward earnings spark fresh investor focus
Money Forward (TSE:3994) moved into the spotlight after reporting nine month earnings to August 2026, shifting from a prior loss to a ¥498.14 million profit on ¥46,908.75 million in sales.
The latest move into profit has arrived alongside strong share price momentum. Money Forward’s 90 day share price return of 21.47% and year to date share price gain of 38.65% have outpaced its 26.89% 1 year total shareholder return, which hints that optimism has strengthened more recently than over the longer term.
Scan how Money Forward’s profit shift compares with other fast growing software plays by running your filters against the hand picked 73 high quality undiscovered gems in this space.
Money Forward now trades above the average analyst target, while models that estimate intrinsic value still flag a steep discount. Is the market being sensibly cautious about earnings quality, or leaving too much on the table?
Price-to-earnings of 65.7x: Is it justified for Money Forward?
On simple headline numbers, Money Forward trades on a P/E of 65.7x against a last close of ¥6,479, which points to investors paying a rich price relative to current earnings compared with peers.
The P/E ratio links the share price to earnings per share. For a fast growing software player like Money Forward, a higher multiple often signals that the market is placing a premium on expected future profit expansion rather than the current income line.
Context matters here. Earnings have recently flipped into positive territory and forecasts flag earnings growth of 40.1% per year, with revenue growth expected at 16.1% per year and return on equity projected to reach 24.9%. That combination helps explain why traders might accept a steeper P/E today, even while current return on equity of 12.3% is considered low and past figures include a large one off gain of ¥10.1b.
The comparison with other software stocks is sharp. The JP Software industry trades on an average P/E of 18.5x and Money Forward’s peers average 28x, while an estimated fair P/E for the stock sits at 47x. The current 65.7x level is far above both the sector and peer benchmarks, and even well above that fair ratio level the multiple could theoretically move toward if expectations cool.
Explore the SWS fair ratio for Money Forward.
Result: Price-to-earnings of 65.7x (OVERVALUED).
Still, the rich P/E and a history that includes a large one off gain mean that any stumble in Money Forward’s earnings quality could hit sentiment hard.
Find out about the key risks to this Money Forward narrative.
Another view on Money Forward’s value
The P/E looks stretched, but the SWS DCF model paints a very different picture. On that cash flow view, Money Forward at ¥6,479 trades about 70% below an estimated future cash flow value of ¥21,573.78. Is this a genuine mispricing, or is the DCF simply too optimistic?
Look into how the SWS DCF model arrives at its fair value.
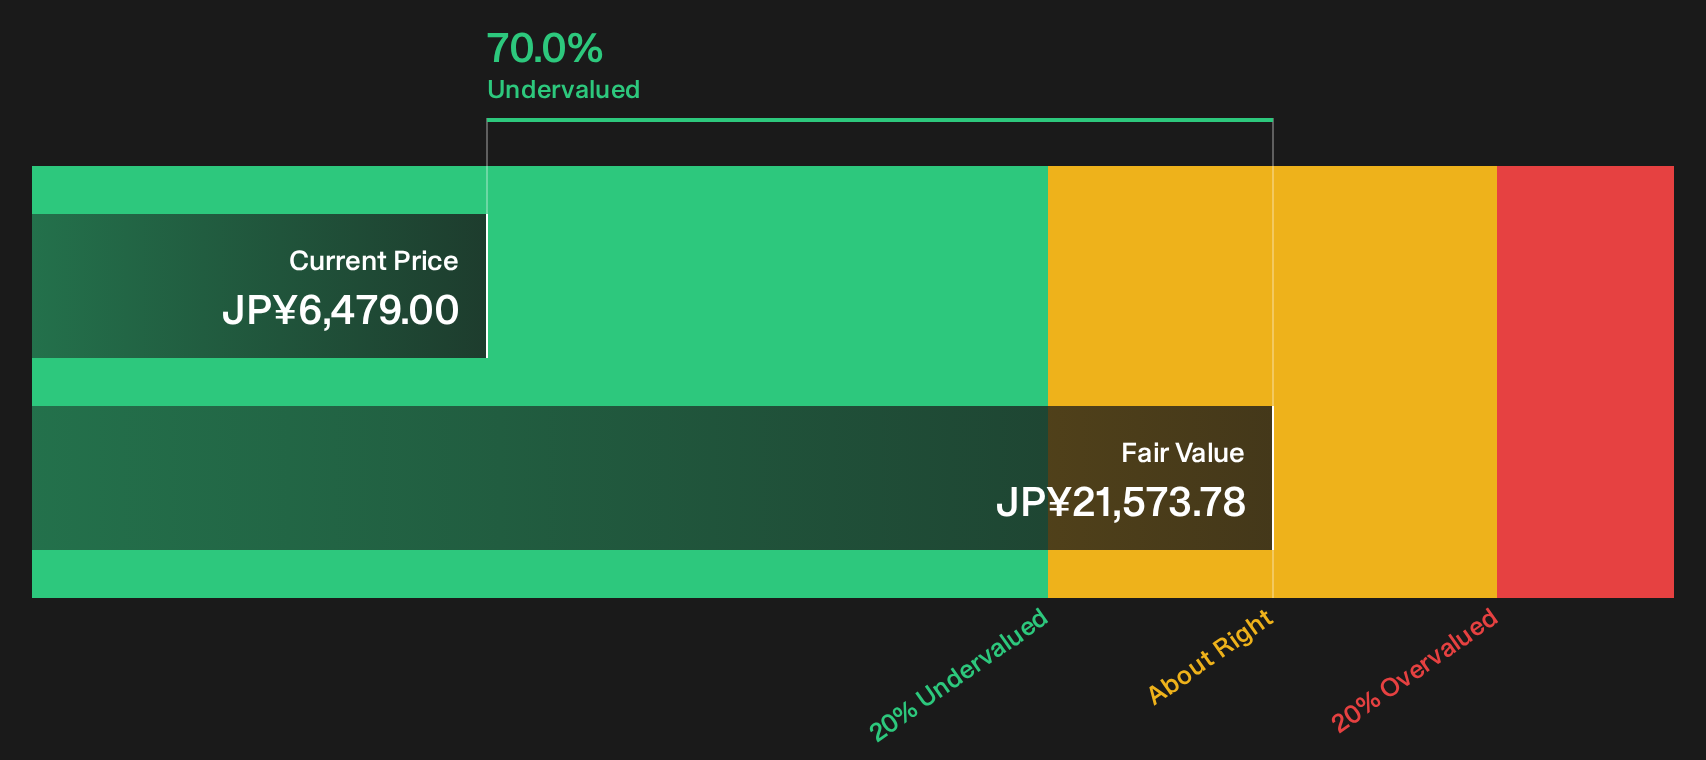
Simply Wall St performs a discounted cash flow (DCF) on every stock in the world every day (check out Money Forward for example). We show the entire calculation in full. You can track the result in your watchlist or portfolio and be alerted when this changes, or use our stock screener to discover 13 high quality undervalued stocks. If you save a screener we even alert you when new companies match - so you never miss a potential opportunity.
Next Steps
Mixed signals on Money Forward’s valuation and earnings quality can pull you in either direction, so move quickly, review the full data set, and weigh the balance of 3 key rewards and 2 important warning signs
Looking for more Money Forward style investment ideas?
If you stop with Money Forward, you could miss other opportunities that fit your approach. Use the Simply Wall Street Screener to pressure test fresh ideas fast.
- Target resilient compounding by focusing on businesses with sturdy finances and consistent performance using the 23 resilient stocks with low risk scores.
- Hunt for quality at a sensible price by scanning companies that look mispriced on fundamentals through the 13 high quality undervalued stocks.
- Anchor your research in financial strength by filtering for stocks with clean balance sheets and solid fundamentals via the list of solid balance sheet and fundamentals (22 results).
This article by Simply Wall St is general in nature. We provide commentary based on historical data and analyst forecasts only using an unbiased methodology and our articles are not intended to be financial advice. It does not constitute a recommendation to buy or sell any stock, and does not take account of your objectives, or your financial situation. We aim to bring you long-term focused analysis driven by fundamental data. Note that our analysis may not factor in the latest price-sensitive company announcements or qualitative material. Simply Wall St has no position in any stocks mentioned.
Have feedback on this article? Concerned about the content? Get in touch with us directly. Alternatively, email editorial-team@simplywallst.com