
- PRICING
- LIVE QUOTES
- LEARN
- HELP


EN
Is PrairieSky Royalty (TSX:PSK) Undervalued On Q3 2026 Expectations And Higher Crude Prices?
PrairieSky Royalty (TSX:PSK) is back in focus as investors look ahead to its Q3 2026 results, weighing higher crude prices, a capital light royalty model, and fresh DCF based valuation debate.
PrairieSky Royalty’s recent momentum is hard to miss, with a 1-day share price return of 3.05% and year to date share price return of 33.44%. A 1-year total shareholder return of 50.66% and 5-year total shareholder return of 174.02% suggest sentiment has been strong over both the short and longer term as investors weigh its royalty model against ongoing valuation debates.
Scan beyond PrairieSky Royalty and line up other cash flow driven energy plays using our hand picked 5 high quality undervalued stocks as a starting point.
PrairieSky Royalty has already delivered strong gains, yet a DCF view still points to a sizeable gap between price and estimated worth. Is most of the move already reflected in the share price, or does that valuation gap remain an advantage for investors?
Price-to-Earnings of 34.8x: Is it justified for PrairieSky Royalty?
Valuation is stretched on a simple P/E view, with PrairieSky Royalty trading on 34.8x earnings compared with both its Canadian oil and gas peers and a peer group average. This comes as the last close sits at CA$36.11 and the DCF estimate implies a fair value of CA$58.19.
The P/E ratio links what you pay today to the profits the business currently generates. For a royalty focused energy stock like PrairieSky Royalty, that means investors are paying a higher price for each dollar of earnings than for many other producers that carry more operational risk.
PSK is described as expensive versus the broader Canadian oil and gas industry, where the average P/E sits at 21.6x. It also screens rich compared with a peer average of 22.7x. That kind of premium often reflects confidence in high quality earnings, steadier royalty cash flows, or the view that current earnings understate future potential. However, it also raises the hurdle for any further re rating if growth or profitability underwhelm.
See what the numbers say about this price, find out in our valuation breakdown See what the numbers say about this price — find out in our valuation breakdown..
Result: Price-to-earnings of 34.8x (OVERVALUED).
Still, the story can change quickly if crude prices soften, or if PrairieSky Royalty’s royalty volumes or collections fall short of what the current valuation implies.
Find out about the key risks to this PrairieSky Royalty narrative.
Another View on PrairieSky Royalty’s Valuation
The P/E screen presents PrairieSky Royalty as expensive, yet the SWS DCF model points in the opposite direction. With the share price at CA$36.11 compared to an estimated cash flow value of CA$58.19, the stock appears undervalued within this framework. Which lens should carry more weight in your process?
Look into how the SWS DCF model arrives at its fair value Look into how the SWS DCF model arrives at its fair value..
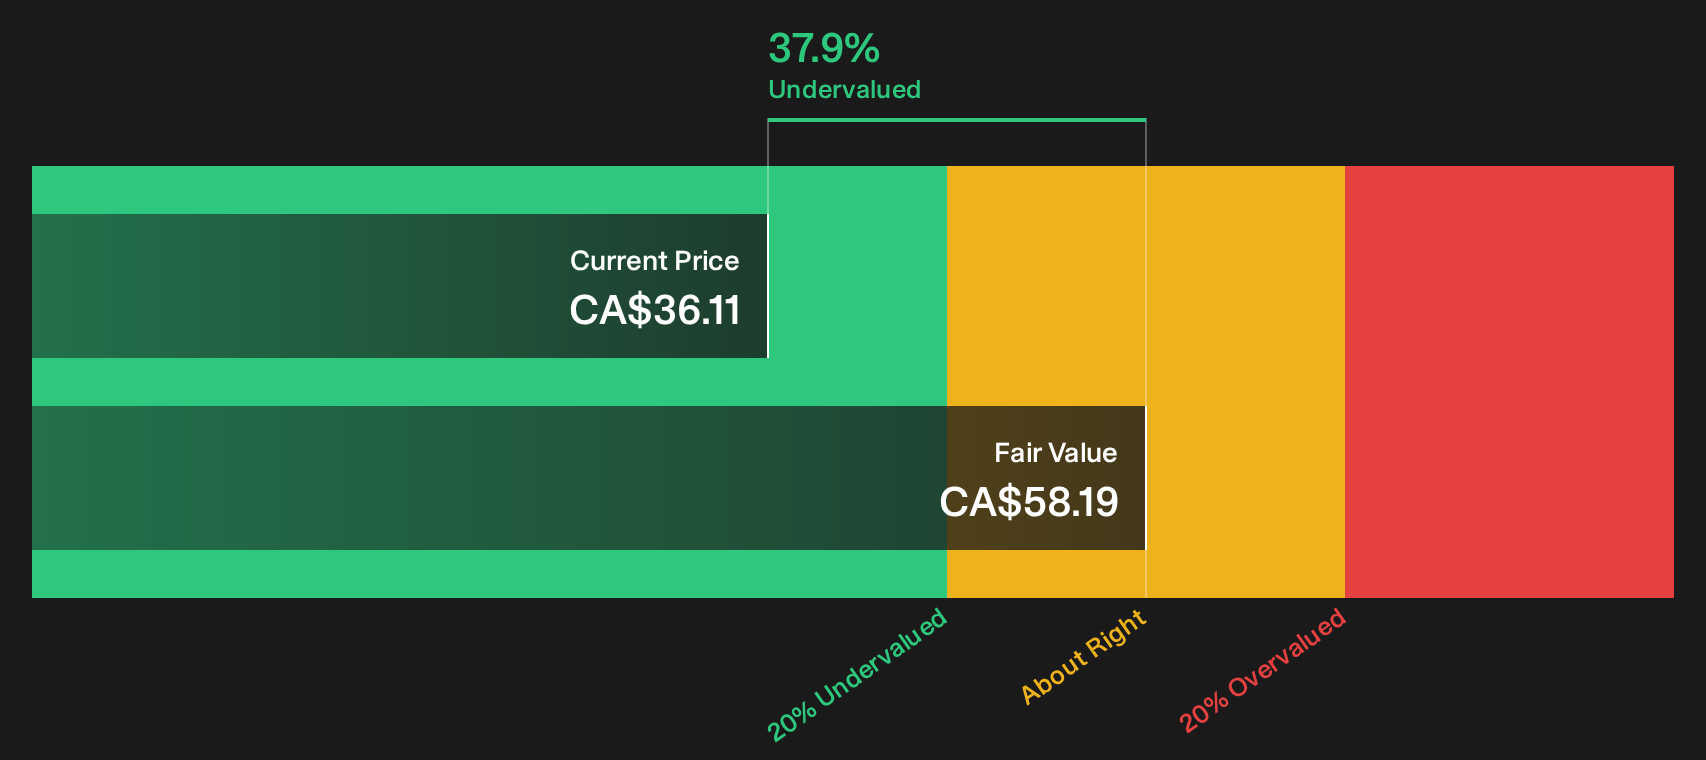
Simply Wall St performs a discounted cash flow (DCF) on every stock in the world every day (check out PrairieSky Royalty for example). We show the entire calculation in full. You can track the result in your watchlist or portfolio and be alerted when this changes, or use our stock screener to discover 5 high quality undervalued stocks. If you save a screener we even alert you when new companies match - so you never miss a potential opportunity.
Next Steps
Mixed signals on PrairieSky Royalty so far, right, with rich multiples on one side and a supportive DCF on the other. If you want to move quickly and build your own view based on both the potential upside and the concerns raised, start with the full picture on 2 key rewards and 1 important warning sign
Looking for more PrairieSky Royalty style investment ideas?
If PrairieSky Royalty has sharpened your focus on quality and valuation, do not stop here. Broaden your watchlist and pressure test your thinking across other opportunities.
- Target resilient compounding by scanning a 3 dividend fortresses that may suit investors who prioritize income alongside enduring business strength.
- Hunt for quality at a discount by working through a 10 high quality undiscovered gems that filters for fundamentals that can support long term conviction.
- Dial down portfolio stress by reviewing a 8 resilient stocks with low risk scores designed to highlight businesses with lower risk scores and steadier profiles.
This article by Simply Wall St is general in nature. We provide commentary based on historical data and analyst forecasts only using an unbiased methodology and our articles are not intended to be financial advice. It does not constitute a recommendation to buy or sell any stock, and does not take account of your objectives, or your financial situation. We aim to bring you long-term focused analysis driven by fundamental data. Note that our analysis may not factor in the latest price-sensitive company announcements or qualitative material. Simply Wall St has no position in any stocks mentioned.
Have feedback on this article? Concerned about the content? Get in touch with us directly. Alternatively, email editorial-team@simplywallst.com