
- PRICING
- LIVE QUOTES
- LEARN
- HELP


EN
Is C&D International Investment Group (SEHK:1908) Undervalued After Softer Contracted Sales?
C&D International Investment Group (SEHK:1908) has drawn fresh attention after reporting unaudited nine-month figures to 30 September 2026. Contracted sales value and gross floor area both recorded year-on-year declines.
Despite softer contracted sales, C&D International Investment Group’s recent trading has been mixed, with a 30-day share price return of 9.11% and a 1-day move of 3.10%. However, the year-to-date share price return is down 13.59% and the 1-year total shareholder return has declined 19.00%, pointing to short-term momentum against a weaker longer-term record as investors reassess both execution risk and valuation.
Compare how C&D International Investment Group stacks up against other real estate developers under pressure by scanning our hand-picked 191 high quality undervalued stocks with resilient balance sheets and compressed valuations.
C&D International Investment Group has scale, recurring service income and backing from a larger parent, yet the share price only just bounced off a weak year. Is that strength already reflected in what you are paying today?
Preferred P/E of 8.6x: Is it justified for C&D International Investment Group?
On simple earnings math, C&D International Investment Group looks cheap. The shares last closed at HK$13.29, while the stock carries a P/E of 8.6x that screens as good value against both peers and internal fair value checks.
The P/E ratio compares the current share price to earnings per share. For a developer and property services group like C&D International Investment Group, it gives a quick read on how much investors are paying for each unit of current profit in a sector where earnings can be cyclical and tied to the property cycle in the People’s Republic of China.
Analysts see earnings growing 10.33% per year, but they also forecast revenue to decline by 4.3% per year over the next three years. That mix suggests the market may be applying a discount to reflect execution risk, lower revenue expectations and a current return on equity of 5.2%, which is described as low. This is the case even though the P/E sits below an estimated fair level of 11.3x that the SWS model suggests the market could move toward if sentiment improved.
The valuation gap is clear. A P/E of 8.6x compares to a peer average of 23.8x and a Hong Kong real estate industry average of 8.9x. That is a steep discount relative to peers and a small discount even relative to the wider sector, which points to investors pricing C&D International Investment Group cautiously despite its high quality earnings assessment and backing from a larger parent.
Explore the SWS fair ratio for C&D International Investment Group.
Result: Price-to-earnings of 8.6x (UNDERVALUED)
Still, the revenue decline of 4.3% and a 3 year total return that fell 9.95% leave C&D International Investment Group vulnerable if sentiment weakens again.
Find out about the key risks to this C&D International Investment Group narrative.
Another View: What The SWS DCF Model Says About C&D International Investment Group
The P/E points one way, but the SWS DCF model points to something far more extreme. At a share price of HK$13.29, C&D International Investment Group is compared with an estimated future cash flow value of HK$313.22, which frames the stock as trading at a very large discount to those modelled cash flows.
Such a wide gap can signal a margin of safety if the projections and discount rate hold up. It can also mean the inputs are too optimistic, or that the market is heavily penalising PRC developer risk that simple cash flow math does not fully capture. Which story do you think fits C&D International Investment Group best?
Look into how the SWS DCF model arrives at its fair value.
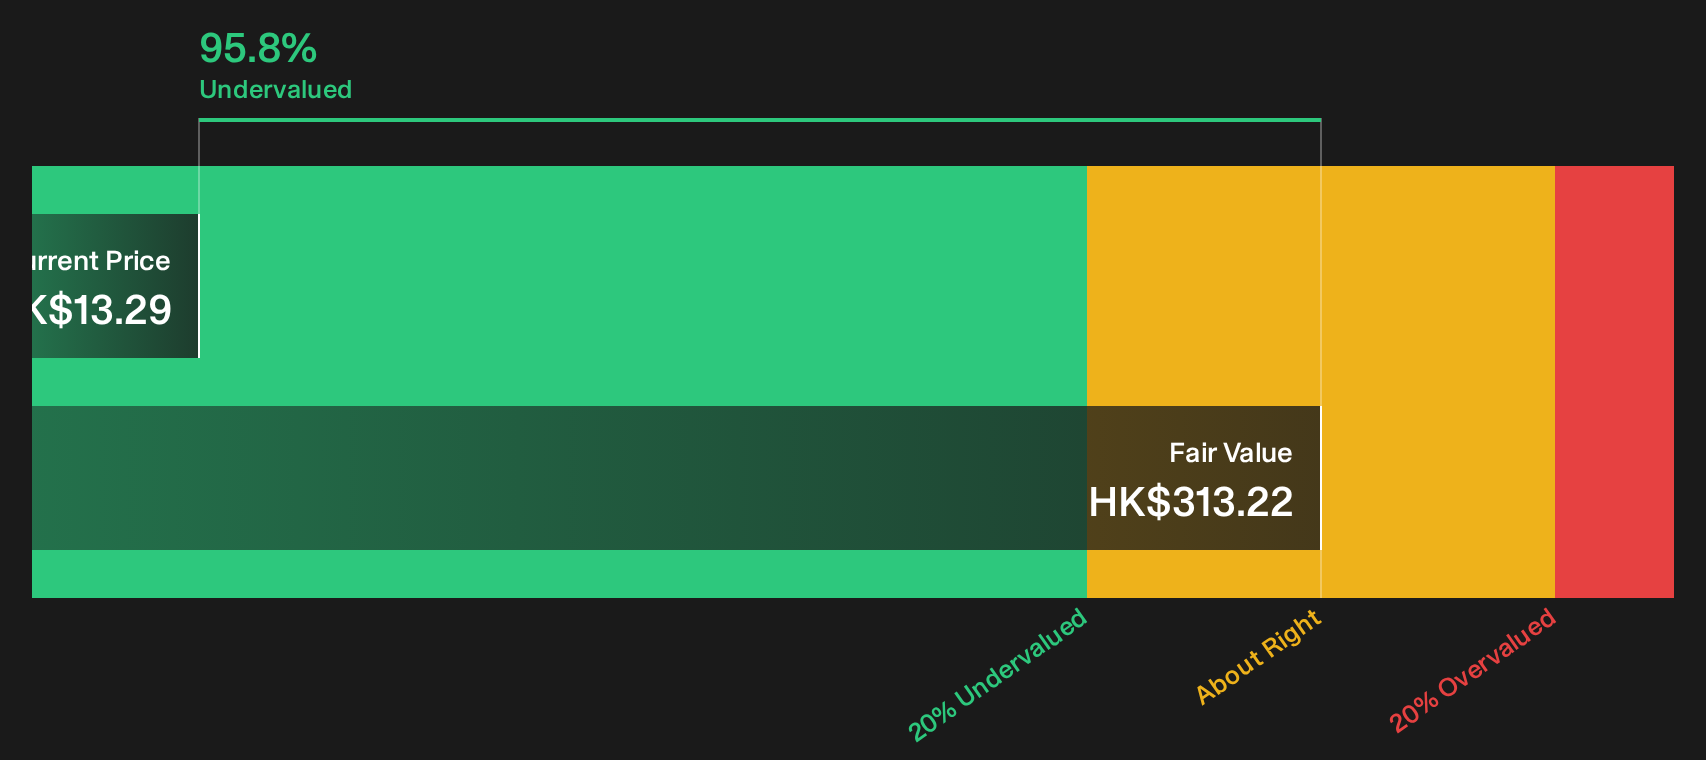
Simply Wall St performs a discounted cash flow (DCF) on every stock in the world every day (check out C&D International Investment Group for example). We show the entire calculation in full. You can track the result in your watchlist or portfolio and be alerted when this changes, or use our stock screener to discover 191 high quality undervalued stocks. If you save a screener we even alert you when new companies match - so you never miss a potential opportunity.
Next Steps
Mixed signals around C&D International Investment Group can feel confusing, so move quickly, review the underlying data, and weigh both sides of the story for yourself. To see how the trade off between possible upside and flagged issues stacks up in one place, take a look at the 4 key rewards and 1 important warning sign.
Looking for more investment ideas beyond C&D International Investment Group?
If C&D International Investment Group has you thinking harder about risk and reward, do not stop here. Broaden your watchlist with fresh ideas that fit different roles in a diversified portfolio.
- Target steadier compounding by reviewing a curated 216 dividend fortresses to help you focus on income generators with higher yields.
- Hunt for potential mispricing by scanning a 614 high quality undiscovered gems that filters for quality metrics the market may be overlooking.
- Dial down portfolio stress by checking a 234 resilient stocks with low risk scores designed to highlight businesses with stronger stability scores.
This article by Simply Wall St is general in nature. We provide commentary based on historical data and analyst forecasts only using an unbiased methodology and our articles are not intended to be financial advice. It does not constitute a recommendation to buy or sell any stock, and does not take account of your objectives, or your financial situation. We aim to bring you long-term focused analysis driven by fundamental data. Note that our analysis may not factor in the latest price-sensitive company announcements or qualitative material. Simply Wall St has no position in any stocks mentioned.
Have feedback on this article? Concerned about the content? Get in touch with us directly. Alternatively, email editorial-team@simplywallst.com