
- PRICING
- LIVE QUOTES
- LEARN
- HELP


EN
Rakus (TSE:3923) Could Be 80% Undervalued Following Its September Sales Update
Rakus stock reacts to preliminary September sales update
Rakus (TSE:3923) released preliminary consolidated sales for September 2026, reporting JPY 4,928 million in monthly revenue. This fresh datapoint provides a timely lens on how the cloud services provider is currently transacting.
The fresh sales update arrives at a time when momentum in Rakus shares has been building, with a 1-month share price return of 6.70% and a 90-day gain of 14.43%, even though the 1-year total shareholder return has declined 3.98% and the 5-year total shareholder return is down 30.21%.
Scan Rakus alongside other cloud and software plays that show similar trading interest using our curated list of 73 high quality undiscovered gems.
Rakus has just posted fresh monthly sales while the share price has already moved higher in recent weeks. Do you lean into that momentum now, or wait for a more forgiving valuation entry point?
Preferred P/E multiple of 16.9x for Rakus: Is it justified?
On Simply Wall St's numbers, Rakus is trading at a P/E of 16.9x, which screens as good value both against peers and the broader Japanese software sector. That figure sits below the JP Software industry average of 18.5x and well under the peer group average of 38.8x, even as the stock changes hands at ¥1,162.
The P/E ratio compares the current share price with earnings per share. For a software-focused business like Rakus, investors often lean on this yardstick because it links what you pay today directly to the profits the firm is currently producing, rather than to assets or sales alone.
Rakus has some context behind that number. Earnings growth over the past year is reported at 157.5%, above both its own 5-year average of 54.9% per year and the Software industry figure of 15%. Net profit margins are described at 40.4%, compared with 18.3% a year earlier. That backdrop suggests the market is not assigning a stretched earnings multiple despite a strong recent profit profile and a forecast Return on Equity of 33.5% in three years. Investors should, however, factor in the large one off gain of ¥16.7b that is influencing the latest results.
The valuation framework also points to where sentiment could gravitate. The estimated fair P/E ratio is 22.2x, which is meaningfully higher than the current 16.9x reading. The gap implies a level the market could move towards if conditions and expectations around Rakus stay aligned with that fair ratio benchmark.
Explore the SWS fair ratio for Rakus.
Result: Price-to-earnings of 16.9x (UNDERVALUED).
Still, Rakus faces pressure if the large one off gain that lifted recent earnings fades, or if sentiment shifts after a 3 year total return of 30.72%.
Find out about the key risks to this Rakus narrative.
Another view on Rakus valuation
The earnings-based P/E story points to value, yet the SWS DCF model goes further. On these cash flow assumptions, Rakus at ¥1,162 is flagged as trading below an estimated value of ¥2,092.68, which frames the stock as undervalued on this lens. Which signal do you treat as more important in your own process?
Look into how the SWS DCF model arrives at its fair value.
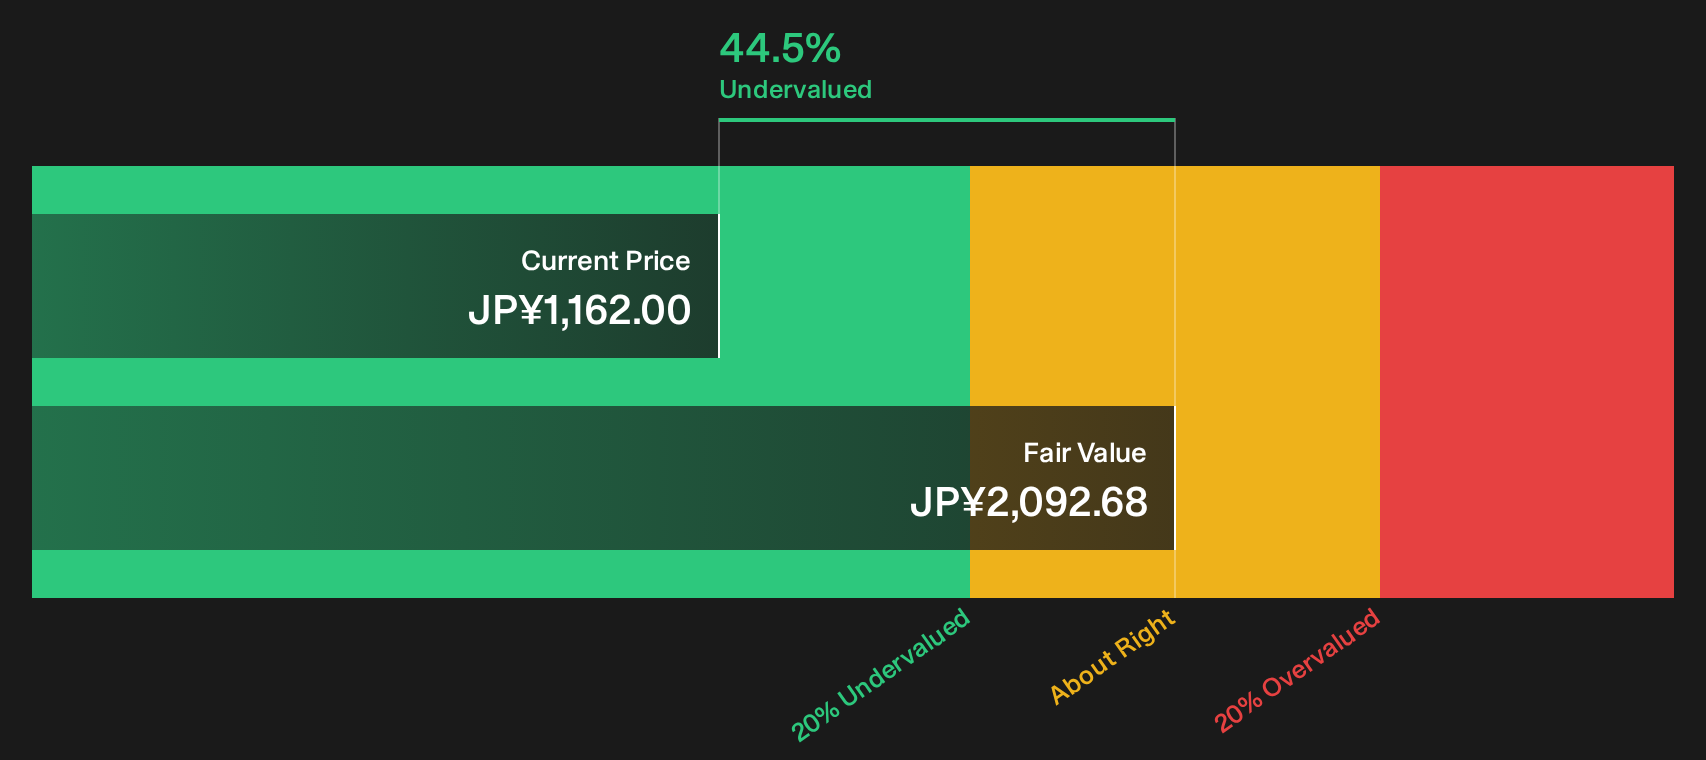
Simply Wall St performs a discounted cash flow (DCF) on every stock in the world every day (check out Rakus for example). We show the entire calculation in full. You can track the result in your watchlist or portfolio and be alerted when this changes, or use our stock screener to discover 13 high quality undervalued stocks. If you save a screener we even alert you when new companies match - so you never miss a potential opportunity.
Next Steps
Mixed signals around Rakus often create as many questions as answers, which is exactly when it pays to move fast and inspect the data yourself. To evaluate potential upside and downside in a balanced way, go through the 4 key rewards and 2 important warning signs
Looking for more Rakus-sized opportunities?
If Rakus has sharpened your thinking, do not stop at a single ticker. Broaden your watchlist now so you are not late to the next idea.
- Target resilient balance sheets and cleaner financial profiles by scanning the list of solid balance sheet and fundamentals (22 results) that pass strict quality filters.
- Hunt for mispriced opportunities by reviewing the 13 high quality undervalued stocks that combine stronger fundamentals with appealing valuations.
- Press your advantage in idea sourcing by checking the 23 resilient stocks with low risk scores that score well on stability and downside protection.
This article by Simply Wall St is general in nature. We provide commentary based on historical data and analyst forecasts only using an unbiased methodology and our articles are not intended to be financial advice. It does not constitute a recommendation to buy or sell any stock, and does not take account of your objectives, or your financial situation. We aim to bring you long-term focused analysis driven by fundamental data. Note that our analysis may not factor in the latest price-sensitive company announcements or qualitative material. Simply Wall St has no position in any stocks mentioned.
Have feedback on this article? Concerned about the content? Get in touch with us directly. Alternatively, email editorial-team@simplywallst.com