
- PRICING
- LIVE QUOTES
- LEARN
- HELP


EN
M3 (TSE:2413) Draws Activist Attention, Is The Stock Fully Priced?
Oasis Management’s move to lift its stake in M3 (TSE:2413) to 9.48% on October 1 has pushed investor focus squarely onto potential shifts in leadership, governance, and capital allocation.
Over the past month M3 has picked up some momentum, with a 1-month share price return of 6.31% and a 7-day move of 2.96%, even though the year-to-date share price return is still down 7.79% and the 1-year total shareholder return is down 9.48%. This hints that Oasis Management’s activism is arriving just as shorter term sentiment starts to rebound, while longer term holders remain underwater.
Scan how activists and long-term healthcare operators line up by reviewing 10 healthcare AI stocks that, like M3, sit at the crossroads of medicine and digital platforms.
M3 still looks like a robust healthcare platform on the surface, and Oasis clearly thinks more value can be drawn out. The open question is whether the current share price already reflects that strength or still leaves a gap.
Preferred P/E of 27.5x for M3: Is it justified?
M3 trades on a P/E of 27.5x, and at a last close of ¥1,911 that valuation looks punchy compared with its sector and fair value checks.
The P/E ratio compares the current share price with earnings per share and gives a quick read on how much investors pay for each unit of profit. For a healthcare services platform that earns revenue from digital tools, clinical research, staffing, and international operations, P/E is often used as a shorthand market gauge of how much future profit growth is reflected in the price.
In this case that gauge is demanding. M3 is flagged as expensive on several fronts, with a P/E of 27.5x versus an estimated fair P/E of 25.4x and against a peer average of 27.3x. The market is also paying a premium to the wider Asian Healthcare Services industry, which trades at 19.4x. The current tag therefore implies investors already assign M3 a richer profile than both its fair ratio and its sector might support if sentiment cooled.
Explore the SWS fair ratio for M3.
Result: Price-to-earnings of 27.5x (OVERVALUED)
Still, the long slide in M3’s 3 and 5 year total shareholder returns, and any disappointment against current profit expectations, could quickly puncture this premium story.
Find out about the key risks to this M3 narrative.
Another view on M3’s valuation
The P/E looks stretched, yet our DCF model paints a softer picture. On that framework, M3 at ¥1,911 sits about 2.1% below an estimated fair value of roughly ¥1,951. For investors, that shift from premium to slight discount raises a simple question: which lens should carry more weight for you?
Look into how the SWS DCF model arrives at its fair value.
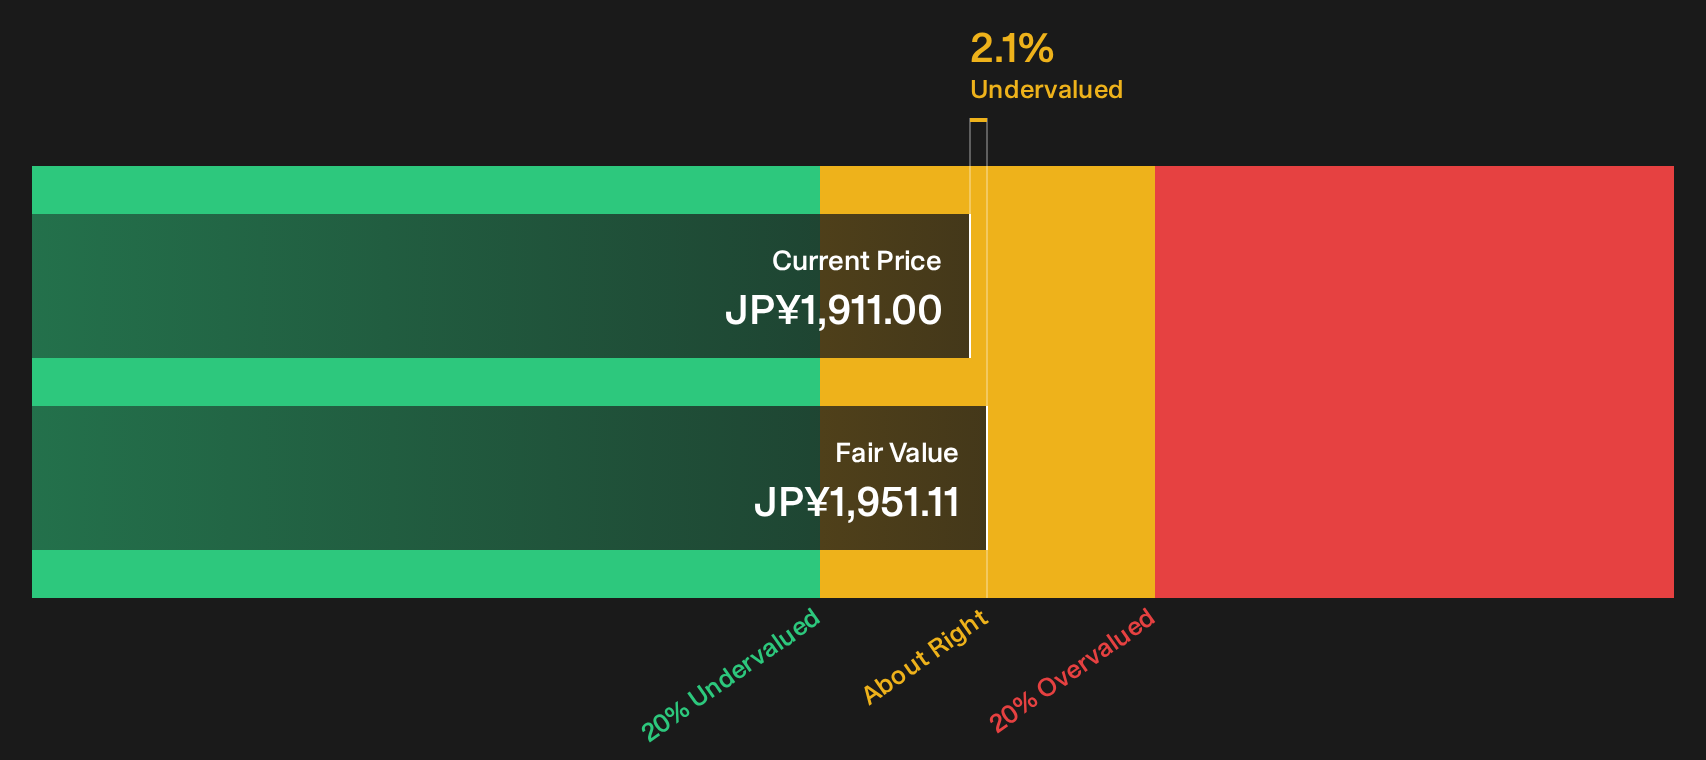
Simply Wall St performs a discounted cash flow (DCF) on every stock in the world every day (check out M3 for example). We show the entire calculation in full. You can track the result in your watchlist or portfolio and be alerted when this changes, or use our stock screener to discover 13 high quality undervalued stocks. If you save a screener we even alert you when new companies match - so you never miss a potential opportunity.
Next Steps
Sentiment around M3 is split, which is exactly when it can be useful to dig into the numbers yourself and decide where you stand. Act promptly and stress test both sides of the story by weighing 2 key rewards and 1 important warning sign
Looking for more M3 style investment ideas?
Do not stop your research with M3. Broaden your watchlist now, compare different setups side by side, and avoid leaving potential opportunities on the table.
- Target resilient income streams by scanning companies described as 29 dividend fortresses that may help anchor a portfolio when sentiment changes.
- Look for potential quality at a discount by reviewing the 13 high quality undervalued stocks that combine stronger fundamentals with prices that lag underlying metrics.
- Focus on capital protection by concentrating on a 23 resilient stocks with low risk scores that aims to limit drawdowns while still pursuing upside.
This article by Simply Wall St is general in nature. We provide commentary based on historical data and analyst forecasts only using an unbiased methodology and our articles are not intended to be financial advice. It does not constitute a recommendation to buy or sell any stock, and does not take account of your objectives, or your financial situation. We aim to bring you long-term focused analysis driven by fundamental data. Note that our analysis may not factor in the latest price-sensitive company announcements or qualitative material. Simply Wall St has no position in any stocks mentioned.
Have feedback on this article? Concerned about the content? Get in touch with us directly. Alternatively, email editorial-team@simplywallst.com