
- PRICING
- LIVE QUOTES
- LEARN
- HELP


EN
China Jinmao Holdings Group (SEHK:817) Reports Fresh Contracted Sales, Is The Valuation Gap Too Wide?
China Jinmao Holdings Group (SEHK:817) has put fresh numbers on the table by releasing preliminary unaudited contracted sales for September and for the nine months to 30 September 2026, giving investors an up to date read on project demand.
The fresh sales update comes after a choppy stretch for China Jinmao Holdings Group, with a 30 day share price return of 5.46% and a 90 day share price decline of 7.04%. Total shareholder return is down 6.73% over one year, and up 46.18% over three years, which indicates that recent momentum is weaker than the longer term record.
Compare China Jinmao Holdings Group's choppy performance with a curated group of real estate peers by scanning list of solid balance sheet and fundamentals (204 results) that may be handling project cycles differently.
Bulls view China Jinmao Holdings Group as a discounted cash flow opportunity, while bears point to choppy returns and earnings risk. Which side does the current valuation actually support?
Preferred P/E of 38x for China Jinmao Holdings Group: Is it justified?
China Jinmao Holdings Group closed at HK$1.255, yet the stock trades on a P/E of 38x, which looks rich beside both peers and its own history of earnings pressure.
The P/E ratio compares what you pay for each unit of current earnings. For real estate developers like China Jinmao Holdings Group, it often reflects how confident the market is that profits can stabilise and then rebuild through the cycle.
Here, the market is effectively assigning a premium tag to a business where earnings have declined by 36.8% per year over the past 5 years and net profit margins are thin at 0.7%. That sits well above the fair P/E estimated at 16.8x. This is a level the valuation work suggests would be more in line with the company’s fundamentals.
The gap is even starker when you line China Jinmao Holdings Group up against others in Hong Kong real estate. The wider industry trades on an average P/E of 8.9x, and the peer group sits near 19.8x, so a 38x multiple prices in a much stronger earnings profile than either group currently reflects.
Explore the SWS fair ratio for China Jinmao Holdings Group.
Result: Price-to-earnings of 38x (OVERVALUED)
Still, if China Jinmao Holdings Group faces renewed pressure on already thin 0.7% net margins or if project demand softens further, the current 38x P/E could unwind quickly.
Find out about the key risks to this China Jinmao Holdings Group narrative.
Another View: SWS DCF model paints a very different picture
The high 38x P/E makes China Jinmao Holdings Group look expensive, yet the SWS DCF model points the other way. With an estimated fair value of HK$24.12 against a HK$1.26 share price, the stock screens as heavily undervalued on future cash flows. Which signal do you trust more?
Look into how the SWS DCF model arrives at its fair value.
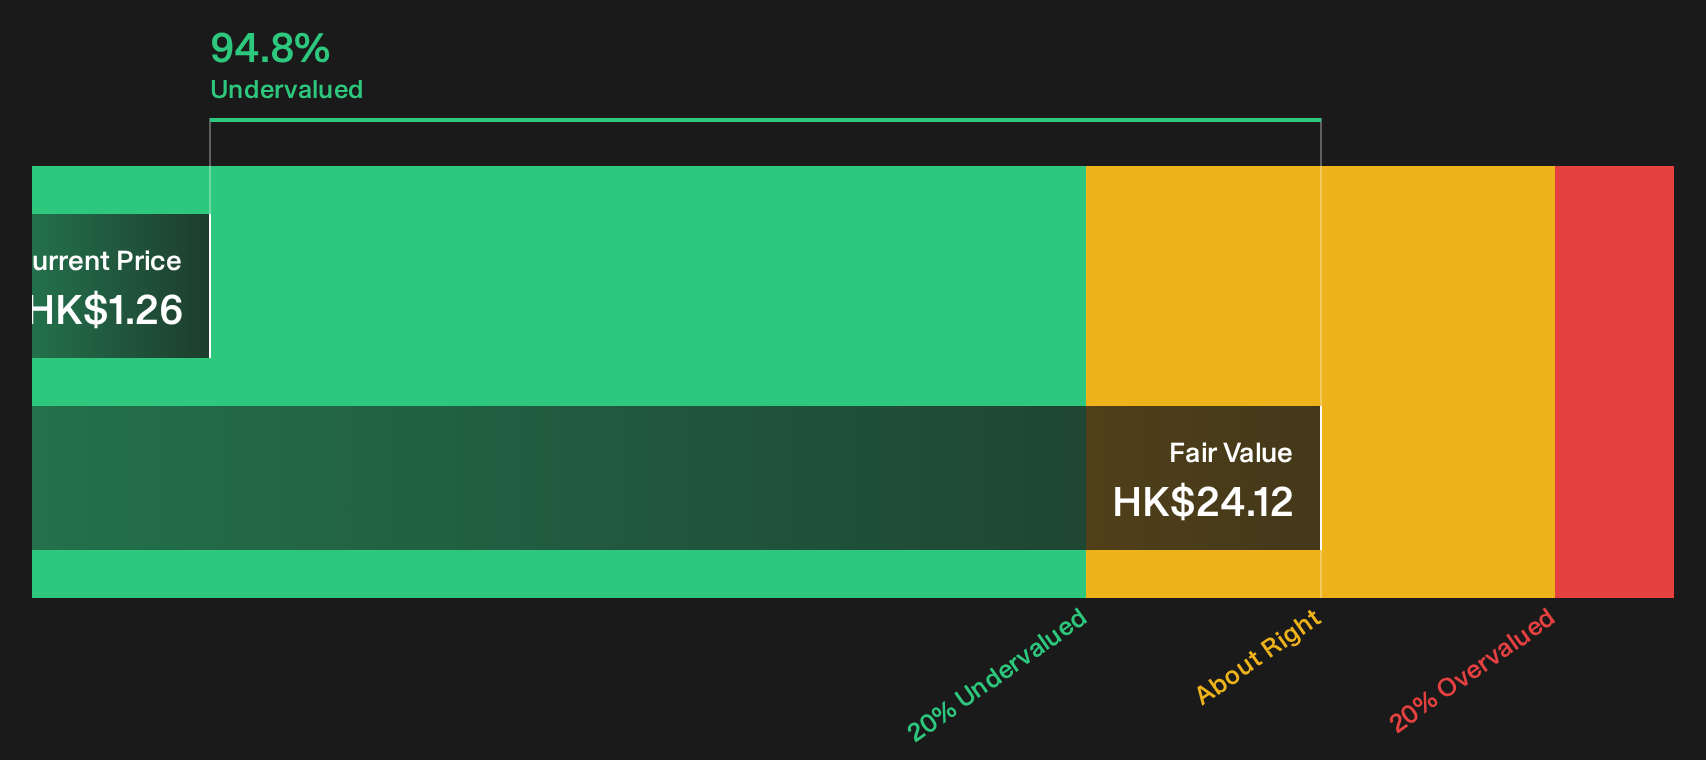
Simply Wall St performs a discounted cash flow (DCF) on every stock in the world every day (check out China Jinmao Holdings Group for example). We show the entire calculation in full. You can track the result in your watchlist or portfolio and be alerted when this changes, or use our stock screener to discover 191 high quality undervalued stocks. If you save a screener we even alert you when new companies match - so you never miss a potential opportunity.
Next Steps
Sentiment around China Jinmao Holdings Group is clearly split, with risks on one side and rewards on the other. Move quickly, review the underlying data, and decide where you stand with the help of 2 key rewards and 1 important warning sign.
Looking for more ideas beyond China Jinmao Holdings Group?
If China Jinmao Holdings Group has sharpened your focus on valuation and risk, you can broaden your watchlist with targeted ideas sourced directly from the Simply Wall St Screener.
- Target potential future compounders by scanning a curated set of 614 high quality undiscovered gems that pair solid fundamentals with under-the-radar market attention.
- Strengthen portfolio resilience by focusing on 234 resilient stocks with low risk scores that score well on financial stability and business predictability.
- Build a foundation of quality by reviewing a list of solid balance sheet and fundamentals (204 results) that can help anchor your returns when conditions shift.
This article by Simply Wall St is general in nature. We provide commentary based on historical data and analyst forecasts only using an unbiased methodology and our articles are not intended to be financial advice. It does not constitute a recommendation to buy or sell any stock, and does not take account of your objectives, or your financial situation. We aim to bring you long-term focused analysis driven by fundamental data. Note that our analysis may not factor in the latest price-sensitive company announcements or qualitative material. Simply Wall St has no position in any stocks mentioned.
Have feedback on this article? Concerned about the content? Get in touch with us directly. Alternatively, email editorial-team@simplywallst.com