
- PRICING
- LIVE QUOTES
- LEARN
- HELP


EN
U-NEXT HOLDINGSLtd (TSE:9418) Lifts Dividend Guidance, Is The Premium Valuation Still Justified?
U-NEXT HOLDINGS Ltd (TSE:9418) has put a spotlight on shareholder returns after guiding for higher dividends for the fiscal year ending August 2027, even as recent profit margins have come under pressure.
The latest guidance arrived after a mixed stretch in the market for U-NEXT HOLDINGSLtd, with the share price delivering a 90-day return of 5.90% but a year-to-date share price decline of 10.70%. The 5-year total shareholder return of 70.22% points to stronger longer-run compounding despite recent pressure.
Spot emerging income opportunities by comparing U-NEXT HOLDINGSLtd's dividend move with our hand-picked 29 dividend fortresses, which is poised to reward patient shareholders.Dividend guidance is moving up while profit margins have come under strain. For U-NEXT HOLDINGS Ltd at ¥1,777 today, does that trade off still leave enough potential to justify the risk on valuation grounds?
Price-to-Earnings of 21.4x: Is it justified?
U-NEXT HOLDINGS Ltd trades on a P/E of 21.4x at a last close of ¥1,777, while our cash flow estimate points to a fair value of ¥1,794.76. For readers, that sets up a small valuation gap, with the shares trading about 1% below the future cash flow estimate despite profit margins coming under pressure.
The P/E ratio compares the current share price with earnings per share and is a common way to see how much investors are paying for each unit of profit. For a telecom and services group like U-NEXT HOLDINGS Ltd, a higher multiple can point to expectations for steadier earnings or more resilient cash generation than lower rated peers.
Management has earnings forecast growth of 10.81% per year and revenue forecast growth of 7.9% per year, which is expected to be faster than the wider JP market on both measures. That helps explain why the SWS DCF model finds the stock trading slightly below its estimated future cash flow value of ¥1,794.76, even after a year where net profit margins moved down from 4.7% to 3.2% and earnings declined by 18.7%.
The comparison with peers is tougher. U-NEXT HOLDINGS Ltd’s 21.4x P/E is described as expensive against both the Asian telecom industry average of 14.3x and the peer average of 13.2x. It is also well above the estimated fair P/E of 17.5x, which suggests that the current market pricing sits at a premium level and could move closer to that fair ratio if sentiment or growth expectations cool.
Explore the SWS fair ratio for U-NEXT HOLDINGSLtd.
Result: Price-to-Earnings of 21.4x (OVERVALUED)
Still, pressure on U-NEXT HOLDINGS Ltd’s net profit margin and any shift in appetite for premium telecom valuations could quickly challenge the current shareholder return story.
Find out about the key risks to this U-NEXT HOLDINGSLtd narrative.
Another view on U-NEXT HOLDINGS Ltd’s value
The SWS DCF model puts U-NEXT HOLDINGS Ltd’s future cash flow value at ¥1,794.76, a touch above the current ¥1,777 price. This points to the shares trading slightly below that estimate. That is a modest cushion if earnings forecasts or cash generation assumptions end up proving too optimistic.
Look into how the SWS DCF model arrives at its fair value.
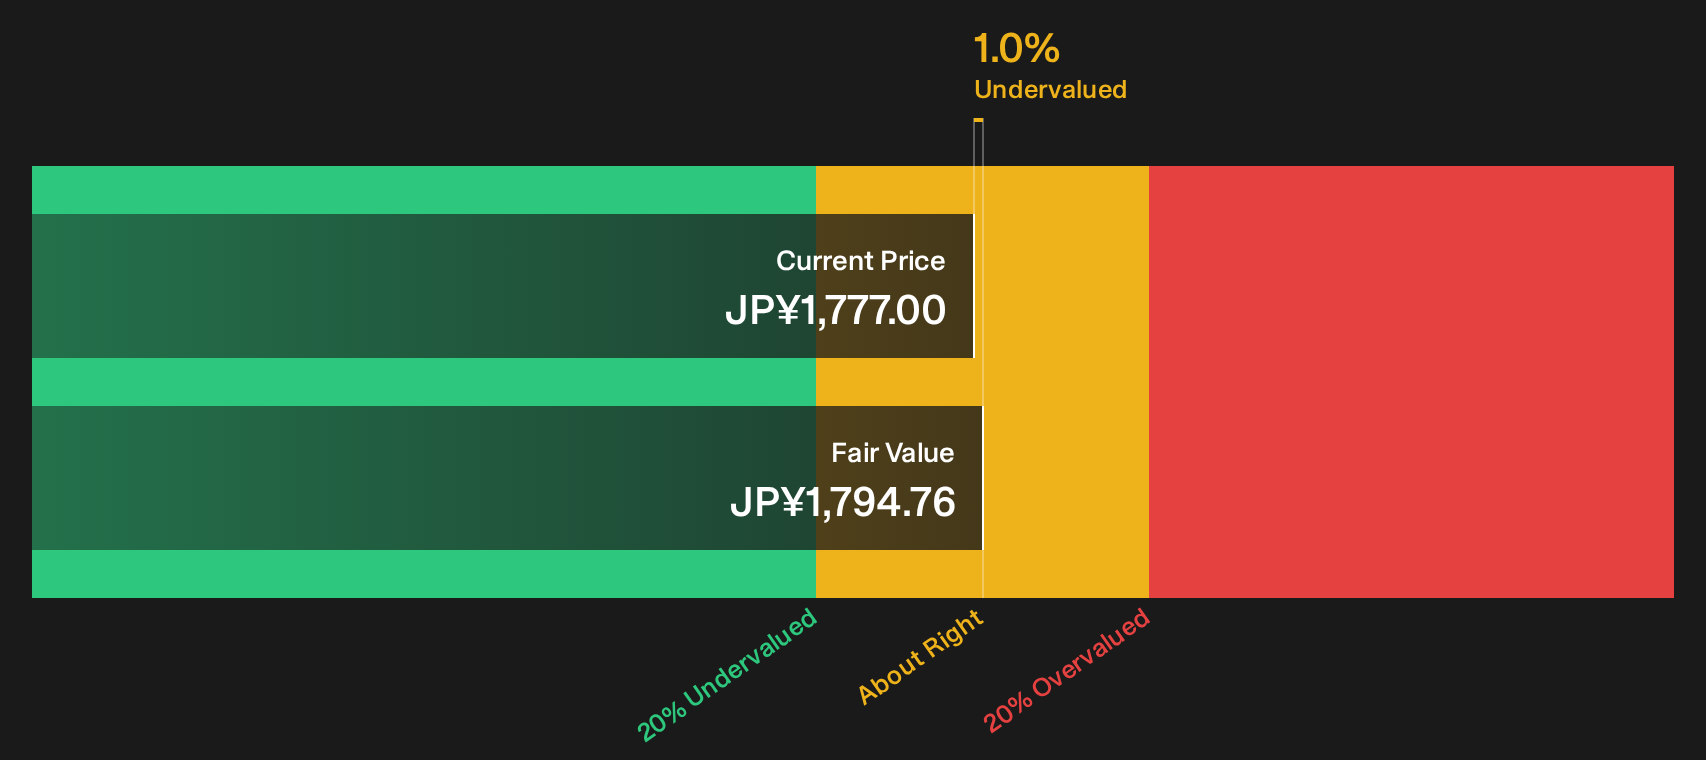
Simply Wall St performs a discounted cash flow (DCF) on every stock in the world every day (check out U-NEXT HOLDINGSLtd for example). We show the entire calculation in full. You can track the result in your watchlist or portfolio and be alerted when this changes, or use our stock screener to discover 13 high quality undervalued stocks. If you save a screener we even alert you when new companies match - so you never miss a potential opportunity.
Next Steps
Mixed signals around U-NEXT HOLDINGS Ltd can feel confusing, so check the underlying data, weigh both sides of the story, then assess the 2 key rewards and 1 important warning sign.
Looking for more investment ideas beyond U-NEXT HOLDINGS Ltd?
If U-NEXT HOLDINGS Ltd has caught your eye, do not stop with a single ticker. Comparing several clear, data backed ideas side by side can help build a stronger portfolio.
- Target resilient cash generators by scanning companies with healthy payouts and balance sheets through the 29 dividend fortresses.
- Hunt for potential mispriced quality by reviewing the 13 high quality undervalued stocks that combine fundamentals with valuation signals.
- Look for possible emerging leaders early by checking the 73 high quality undiscovered gems before they sit on every watchlist.
This article by Simply Wall St is general in nature. We provide commentary based on historical data and analyst forecasts only using an unbiased methodology and our articles are not intended to be financial advice. It does not constitute a recommendation to buy or sell any stock, and does not take account of your objectives, or your financial situation. We aim to bring you long-term focused analysis driven by fundamental data. Note that our analysis may not factor in the latest price-sensitive company announcements or qualitative material. Simply Wall St has no position in any stocks mentioned.
Have feedback on this article? Concerned about the content? Get in touch with us directly. Alternatively, email editorial-team@simplywallst.com