
- PRICING
- LIVE QUOTES
- LEARN
- HELP


EN
What Data Patterns (India) Holders Saw Early
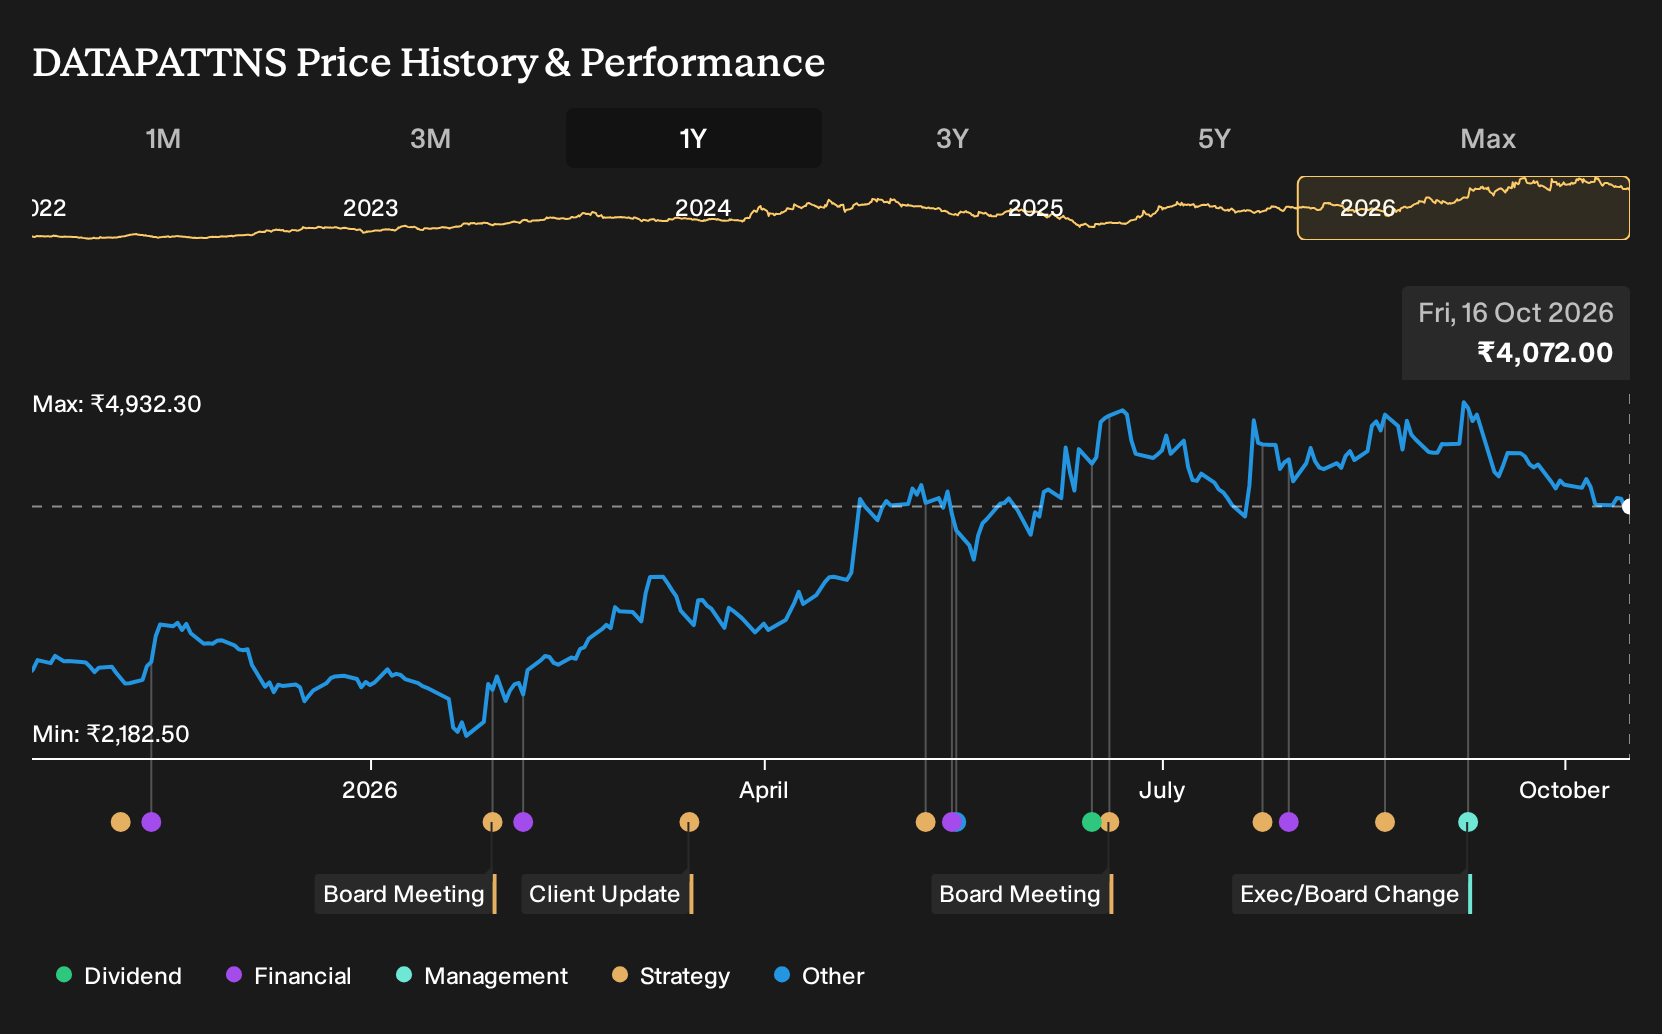
If Data Patterns (India) was on your watchlist instead of in your portfolio, the past year may feel like a missed call. For Data Patterns (India) shareholders, the return over the past year was 45.4%, including dividends. That gain sits against a year in which Q1 2027 results showed higher revenue but a thinner net margin compared with Q1 2026. So what in the earlier R&D heavy, government contract driven story could have flagged this outcome as a risk worth taking?
Data Patterns (India) has already moved. See which of 190 high quality undervalued stocks still trade below our estimates.
The Two Stories Investors Had To Weigh On Data Patterns (India)
The shares cost ₹2,732 at the start of the period, and investors in Data Patterns (India) had to choose which story felt more realistic.
The bullish view was based on heavy in-house R&D and deep government contracts, with the expectation that this would keep high value work coming through. That camp saw a Fair Value of ₹3,137, a notional price based on assumptions like 28.4% annual revenue growth backed by strong demand for indigenous defense electronics.
The cautious camp focused on export hurdles and rising development costs. This side worked with a Fair Value of ₹2,500, built on expectations that heavy recurring R&D and capital spending could pressure net margins if tenders slipped or procurement priorities changed.
What The Q1 Results Put To The Test For Data Patterns (India)
The clearest new fact was Q1 2027 revenue of ₹1,160.3m versus ₹993.3m in Q1 2026, which supported the growth-focused case on Data Patterns (India). Profit told a different story. Net income moved from ₹255m to ₹220.6m and net margin shifted from 25.7% to 19.0%. The evidence pointed in both directions.
The key assumption here was that heavy R&D and capex would protect, rather than squeeze, profitability. When you assess another contractor, track whether net margin trends support the stated earnings quality or simply translate higher sales into thinner profits.
What Data Patterns (India)'s Price Already Bakes In
With Data Patterns (India) now at ₹4,072 after a 45.4% gain over the past year, the selected Narrative still places its Fair Value above that level. That view leans on a story about where earnings quality could land, not just where the share price has moved.
The Narrative leans heavily on proprietary systems, recurring work and defence demand to support that higher figure. A buyer today would need to judge whether a sustained shift toward higher margin, IP-led platforms can genuinely support structurally stronger profitability over time.
"Ongoing investments in both talent and manufacturing infrastructure ahead of order conversion, as well as a deliberate pivot to full-system leadership in radar, EW, and avionics, are cited as factors that could improve operating leverage as execution ramps up."
Not everyone reads the same price the same way. → See the higher figure this Narrative lands on, and how it gets there
One Step Beyond Data Patterns
Looking at Data Patterns, you are mainly thinking about defence electronics. Yet the same appetite for complex hardware exists above the atmosphere.
Every radar, communication or imaging payload that leaves Earth needs a ride. One specialist launcher is trying to make those trips cheaper and more frequent.
This business does more than send hardware uphill. It also builds the satellites that ride on its own rockets.
Cheaper launches plus in house space systems could reshape who captures value in orbit. If that model works, your watchlist might need another layer.
It is written up in full, assumptions and all. → Explore the Narrative that puts this company 92% above its price
This article by Simply Wall St is general in nature. We provide commentary based on historical data and analyst forecasts only using an unbiased methodology and our articles are not intended to be financial advice. It does not constitute a recommendation to buy or sell any stock, and does not take account of your objectives, or your financial situation. We aim to bring you long-term focused analysis driven by fundamental data. Note that our analysis may not factor in the latest price-sensitive company announcements or qualitative material. Simply Wall St has no position in any stocks mentioned.
Have feedback on this article? Concerned about the content? Get in touch with us directly. Alternatively, email editorial-team@simplywallst.com