
- PRICING
- LIVE QUOTES
- LEARN
- HELP


EN
YONEX (TSE:7906) Could Be 70% Undervalued Despite A Choppy Share Price
With no single headline driving attention, interest in YONEX (TSE:7906) has instead been shaped by its recent share performance and fundamentals, as investors reassess the sporting equipment specialist.
Recent trading has been choppy. The share price is at ¥2,443 after a 1-day share price return of 4.22% and a 7-day share price return of 2.47%. However, the year-to-date share price return is down 27.40%, while the 5-year total shareholder return of 243.40% shows how long term holders have still been well rewarded.
Scan beyond YONEX and compare its performance swing to a hand picked group of consumer companies with resilient fundamentals using the list of solid balance sheet and fundamentals (22 results).
So is the recent 1 day jump just sentiment snapping back after a weak year, or does the current ¥2,443 price already line up with what YONEX’s earnings and cash flows suggest the business is worth?
Preferred P/E of 15.5x: Is it justified?
On simple earnings math, YONEX trades on a P/E of 15.5x, which investors can weigh against both its recent profit growth and where peers sit today.
The P/E ratio links the ¥2,443 share price to the earnings that the business currently produces. For a consumer durables player like YONEX, that matters because profit tends to move with demand cycles, branding strength, and how efficiently management converts revenue into the bottom line.
YONEX has grown earnings by 11.8% over the past year, with a 5 year earnings growth rate of 19.4% per year, and its earnings growth over the past year exceeded the Leisure industry at 1.5%. Earnings are forecast to grow 8.7% per year, and revenue is forecast to grow 9% per year compared to 6.6% for the broader JP market. At the same time, current net profit margins of 7.9% are slightly lower than last year at 8.2%, and return on equity of 15.7% is described as low compared to a 20% threshold. That mix of solid historic growth, moderating forward expectations, and mid teens profitability gives context to the multiple.
Relative to peers, the picture shifts. The 15.5x P/E is lower than both the JP Leisure industry average of 16.6x and the peer average of 18.2x, which indicates the stock trades at a discount to comparable companies even though it has grown earnings faster than the sector in the recent year. Against an estimated fair P/E of 15.2x, the current 15.5x is described as slightly expensive, which suggests limited room for the ratio to stretch higher if conditions stay similar and could act as a level the market moves back towards.
Explore the SWS fair ratio for YONEX.
Result: Price-to-earnings of 15.5x (ABOUT RIGHT)
Still, the recent 1 year total return decline of 35.57% and a value score of 4 suggest sentiment could stay fragile if earnings or demand disappoint.
Find out about the key risks to this YONEX narrative.
Another view on YONEX’s value
The P/E discussion presents YONEX as roughly in line with a fair ratio of 15.2x, yet the SWS DCF model offers a different perspective. On that cash flow view, the shares at ¥2,443 trade below an estimated value of ¥4,145.42, which highlights a wide gap that investors need to interpret for themselves.
That difference raises a simple question for anyone watching YONEX. Is the market correctly pricing in slower forecast growth of 8.7% a year for earnings, or is sentiment leaning too much on recent share price weakness and not fully considering the cash flow profile indicated by our DCF model.
Look into how the SWS DCF model arrives at its fair value.
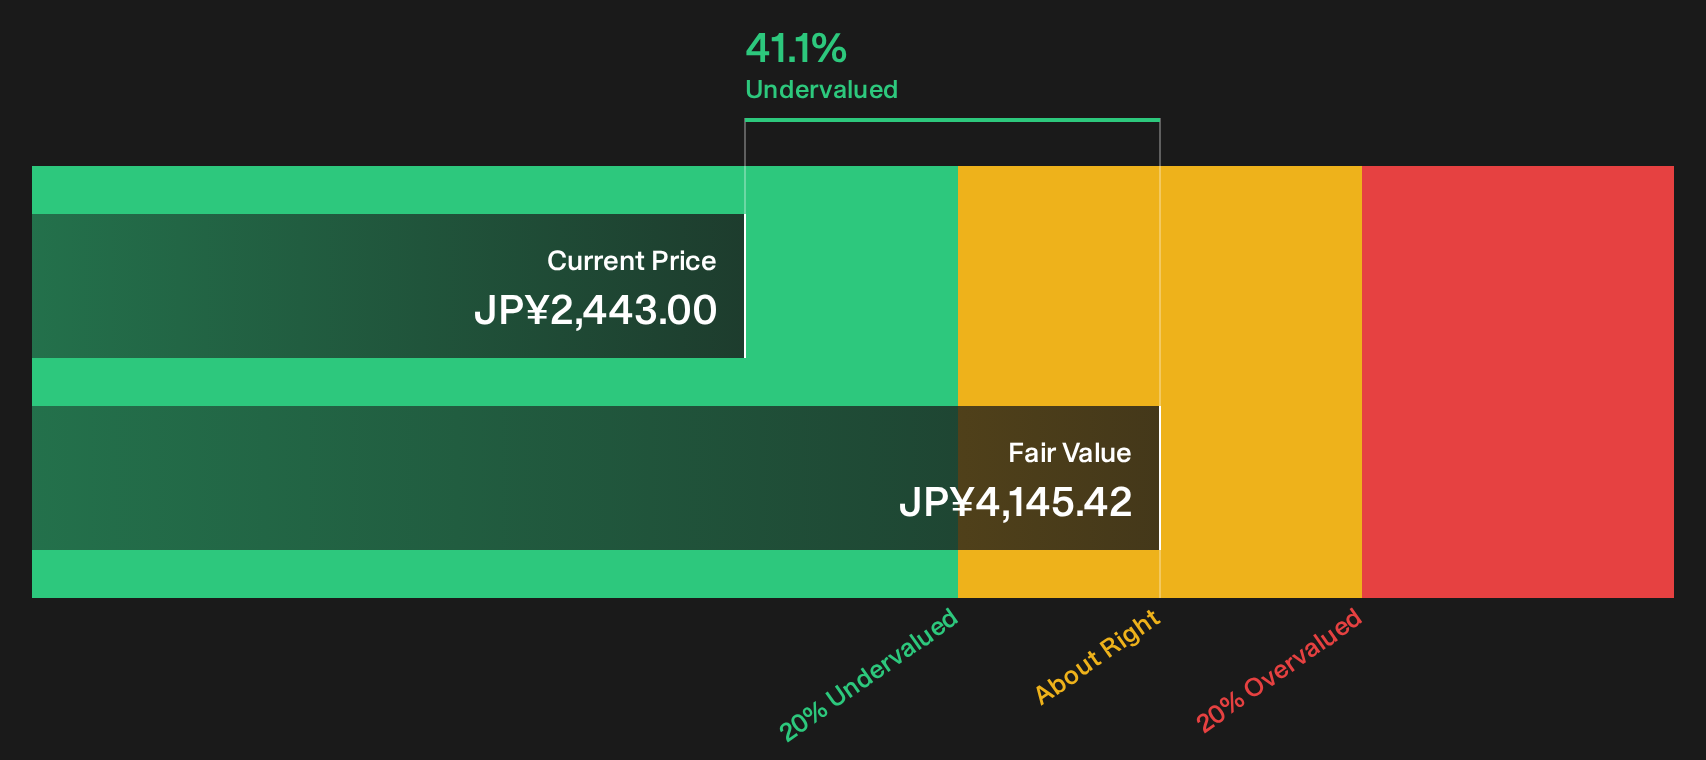
Simply Wall St performs a discounted cash flow (DCF) on every stock in the world every day (check out YONEX for example). We show the entire calculation in full. You can track the result in your watchlist or portfolio and be alerted when this changes, or use our stock screener to discover 13 high quality undervalued stocks. If you save a screener we even alert you when new companies match - so you never miss a potential opportunity.
Next Steps
With sentiment mixed across YONEX, consider this your cue to review the numbers yourself and position your strategy before the broader market reacts. To see the upside case that current optimists are focusing on, review the 3 key rewards.
Looking for more YONEX-sized investment ideas?
Do not stop with YONEX. Use the Simply Wall St screener to spot fresh opportunities that fit your own return goals and risk comfort.
- Target potential bargains before the crowd by scanning companies that combine quality with attractive pricing through the 13 high quality undervalued stocks.
- Build a steadier income stream by focusing on businesses with robust payouts using the 29 dividend fortresses.
- Prioritise resilience first and hunt for companies with stronger balance sheets and fundamentals via the list of solid balance sheet and fundamentals (22 results).
This article by Simply Wall St is general in nature. We provide commentary based on historical data and analyst forecasts only using an unbiased methodology and our articles are not intended to be financial advice. It does not constitute a recommendation to buy or sell any stock, and does not take account of your objectives, or your financial situation. We aim to bring you long-term focused analysis driven by fundamental data. Note that our analysis may not factor in the latest price-sensitive company announcements or qualitative material. Simply Wall St has no position in any stocks mentioned.
Have feedback on this article? Concerned about the content? Get in touch with us directly. Alternatively, email editorial-team@simplywallst.com