
- PRICING
- LIVE QUOTES
- LEARN
- HELP


EN
Learn Why The Bull Case For Reliance Stock Could Change Following Higher Earnings Forecasts
- Reliance, Inc. is now expected to report quarterly earnings of US$6.76 per share, with analysts attributing the stronger outlook to projected net sales strength in carbon steel and aluminum segments.
- The upward revision of consensus EPS estimates over the past 30 days highlights how segment level demand expectations are feeding directly into Reliance’s overall earnings profile.
- We will now test how Reliance’s investment narrative holds up against sharply higher EPS expectations tied to carbon steel segment sales.
Compare how Reliance’s higher EPS expectations stack up against other metal producers by reviewing the hand picked list of solid balance sheet and fundamentals (25 results) that could benefit from similar demand trends.
Reliance Investment Narrative Recap
To own Reliance, you need to believe the metals service center model can keep turning demand from data centers, infrastructure and defense work into steady shipments and resilient profitability. The higher near term EPS expectations sit on top of this thesis rather than redefine it. The key near term catalyst remains execution on value added processing and contract volumes.
The biggest near term risk is still metal input volatility and tariff policy, especially around aluminum and carbon steel. Higher projected earnings do not offset the pressure from elevated LIFO charges and potential margin compression if tariffs or prices move sharply, even while underlying customer demand looks supportive.
One of the most relevant reference points for this outlook is management’s 2026 guidance for LIFO expense, which has been raised in stages from US$100 million to US$300 million as carbon and aluminum costs moved higher. That context matters when you weigh rising EPS expectations tied to carbon steel sales.
For you as a Reliance shareholder, the link between stronger segment pricing and heavier non cash inventory charges is central. Higher forecast earnings might coincide with tighter reported gross margins if tariffs and input costs remain elevated, so the real catalyst to watch is not only volume, it is how efficiently the business converts that volume into cash after these accounting and cost headwinds.
What The New Reliance Forecasts Actually Assume
Reliance's narrative projects US$17.9b revenue and US$1.2b earnings by 2029. This implies 4.2% yearly revenue growth and an earnings increase of about US$306m from current earnings of US$893.8m.
Uncover why Reliance's fair value suggests that Reliance is approximately in line with its current price.
Exploring Other Perspectives
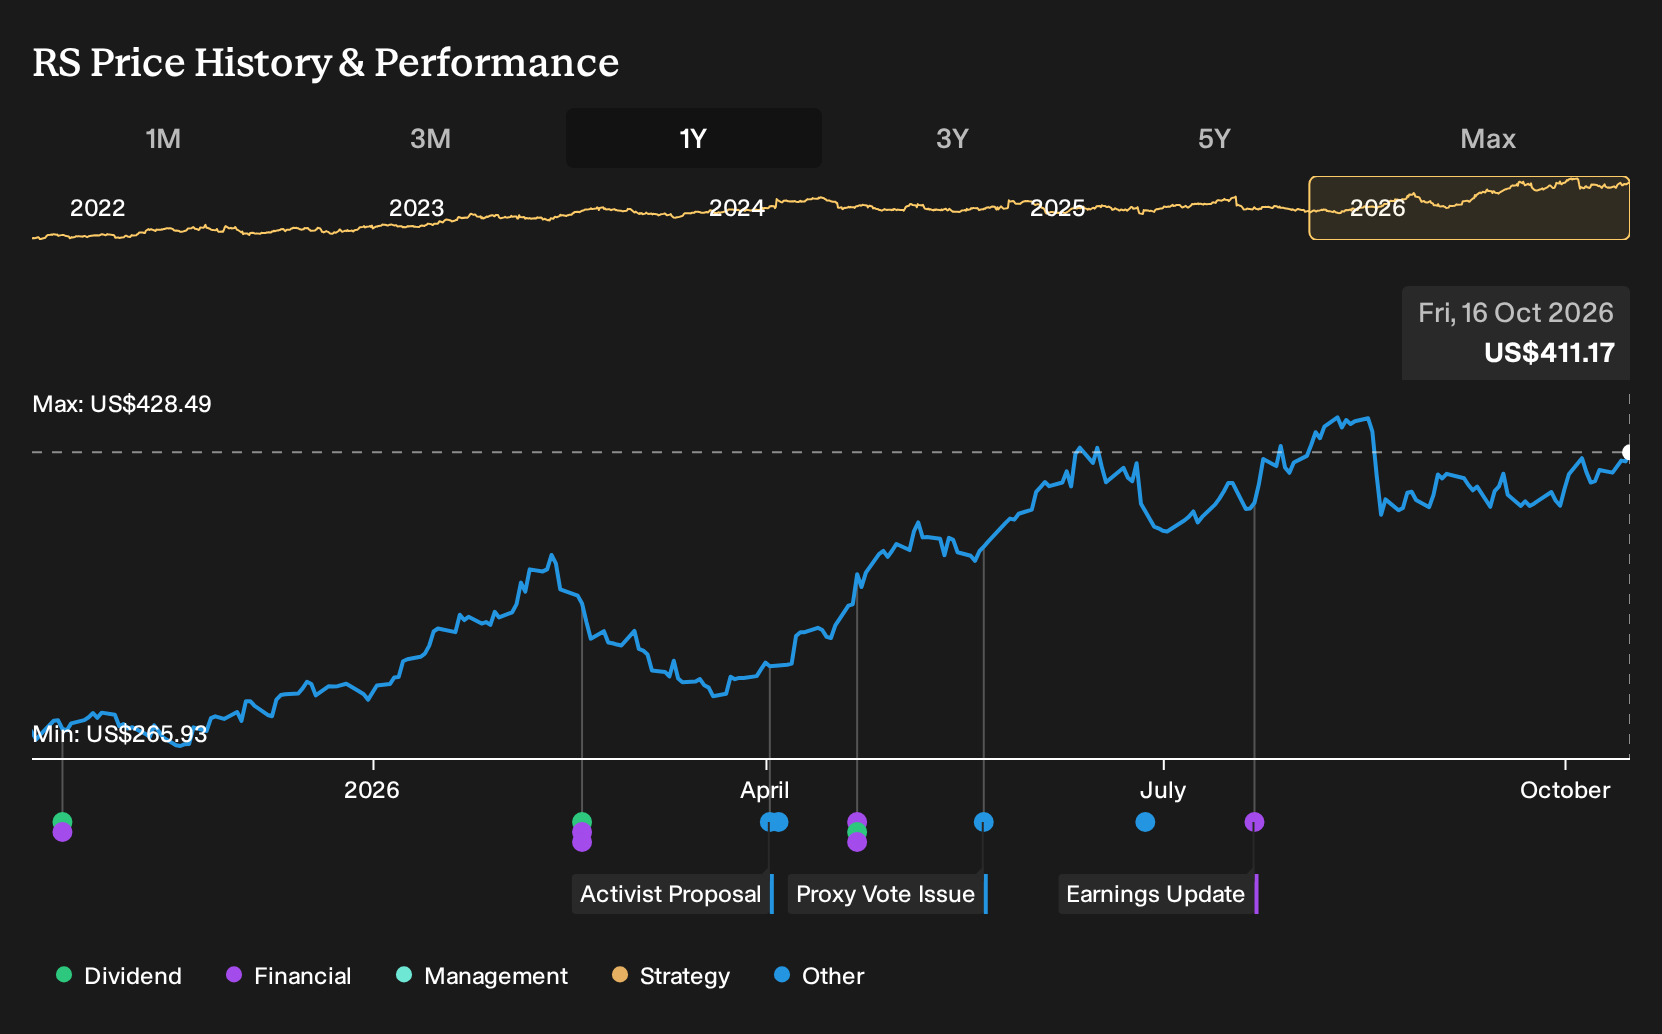
Two fair value estimates from the Simply Wall St Community span roughly US$220 to US$409 per share, a wide gap for Reliance that underlines how far opinions can spread. Those views sit beside tariff risk, LIFO swings and data center or infrastructure demand as live forces. Use the spread to explore sharply different takes.
Explore another Reliance fair value estimate, including one that suggests as much as 46% downside from the current price.
Form Your Own Verdict
Disagree with existing narratives? Extraordinary investment returns rarely come from following the herd, so consider conducting your own research and forming your own view.
- A great starting point for your Reliance research is our analysis highlighting 1 key reward and 1 important warning sign that could impact your investment decision.
- See our latest analysis for Reliance. The report includes a comprehensive fundamental analysis summarized in a single visual, the Snowflake, making it easy to evaluate Reliance's overall financial health at a glance.
Looking For More Investment Ideas Beyond Reliance?
Once you have a view on Reliance, it can help to widen the lens and compare it with other businesses that share similar qualities or offer different risk and income profiles. The Simply Wall St screener lets you quickly filter for companies that match the kind of balance sheet strength, valuation profile or payout pattern you want to focus on next.
- If capital preservation is high on your list, review a focused group of stocks with resilient finances using the 32 resilient stocks with low risk scores.
- If you want income on top of potential price gains, scan companies offering robust payout yields through the 8 dividend fortresses.
- If you are hunting for less crowded opportunities with healthier fundamentals, check out the 20 high quality undiscovered gems that might warrant a spot on your watchlist.
This article by Simply Wall St is general in nature. We provide commentary based on historical data and analyst forecasts only using an unbiased methodology and our articles are not intended to be financial advice. It does not constitute a recommendation to buy or sell any stock, and does not take account of your objectives, or your financial situation. We aim to bring you long-term focused analysis driven by fundamental data. Note that our analysis may not factor in the latest price-sensitive company announcements or qualitative material. Simply Wall St has no position in any stocks mentioned.
Have feedback on this article? Concerned about the content? Get in touch with us directly. Alternatively, email editorial-team@simplywallst.com