
- PRICING
- LIVE QUOTES
- LEARN
- HELP


EN
TISI (TSE:3626) Lands Major Digital Finance Wins, Is The Stock Still Undervalued?
TISI (TSE:3626) is back on investor radars after Japan’s three megabanks completed a yen stablecoin pilot using its blockchain platform, and Huawei named the firm a founding AI CITY ecosystem partner.
TISI’s ¥4,395 share price sits on the back of a sharp short-term rebound, with a 1-month share price return of 9.6% and a 90-day share price gain of 24.65%. However, the year-to-date share price return is down 15.11% and the 1-year total shareholder return is lower by 6.8%. In contrast, 3-year and 5-year total shareholder returns of 48.71% and 56.21% suggest momentum has built over a longer horizon as investors respond to its role in digital finance and smart city projects.
Spot under-the-radar peers riding similar themes in digital finance and smart city infrastructure by scanning our handpicked 55 AI infrastructure stocks.TISI now trades at a small premium to analyst targets, yet still shows an intrinsic value gap on some models. Is the recent rebound just catching up to fair value, or already running ahead of it?
Price-to-Earnings of 19x: Is it justified?
TISI now screens as undervalued on earnings-based metrics, with a P/E of 19x versus a peer average of 24.1x and an estimated fair P/E of 23.9x, even though the share price of ¥4,395 sits modestly above analyst targets.
The P/E ratio compares what investors are paying for each unit of current earnings, which matters for an IT services group like TISI where profitability and cash generation are central to the story. With 6.8% annual earnings growth over the past 5 years and high quality earnings flagged, the current multiple suggests the market is putting a lower earnings tag on the business than both the fair ratio model and comparable IT stocks.
Relative to the broader JP IT industry on 16.1x, the stock trades on a richer headline multiple. However, the fair ratio work points toward a level closer to 23.9x that the market could move toward if confidence in profit growth and cash flows improves. The DCF view supports this, with our model indicating the current price sits around 12% below an estimated future cash flow value of ¥4,992.02. This reinforces the idea that the earnings-based valuation is not stretched.
Explore the SWS fair ratio for TISI.
Result: Price-to-Earnings of 19x (UNDERVALUED)
Still, TISI faces real pressure if client tech budgets tighten or if yen stablecoin rules shift, as either development could cool demand for its financial IT services.
Find out about the key risks to this TISI narrative.
Another View on TISI’s Value
The P/E work paints TISI as inexpensive, and the SWS DCF model also points to value, with an estimated future cash flow value of ¥4,992.02 against a market price of ¥4,395. That 12% gap suggests the earnings multiple is not the only signal hinting at potential mispricing. With both methods pointing in the same direction, the key question may be whether the focus should be on growth durability rather than entry price.
Look into how the SWS DCF model arrives at its fair value.
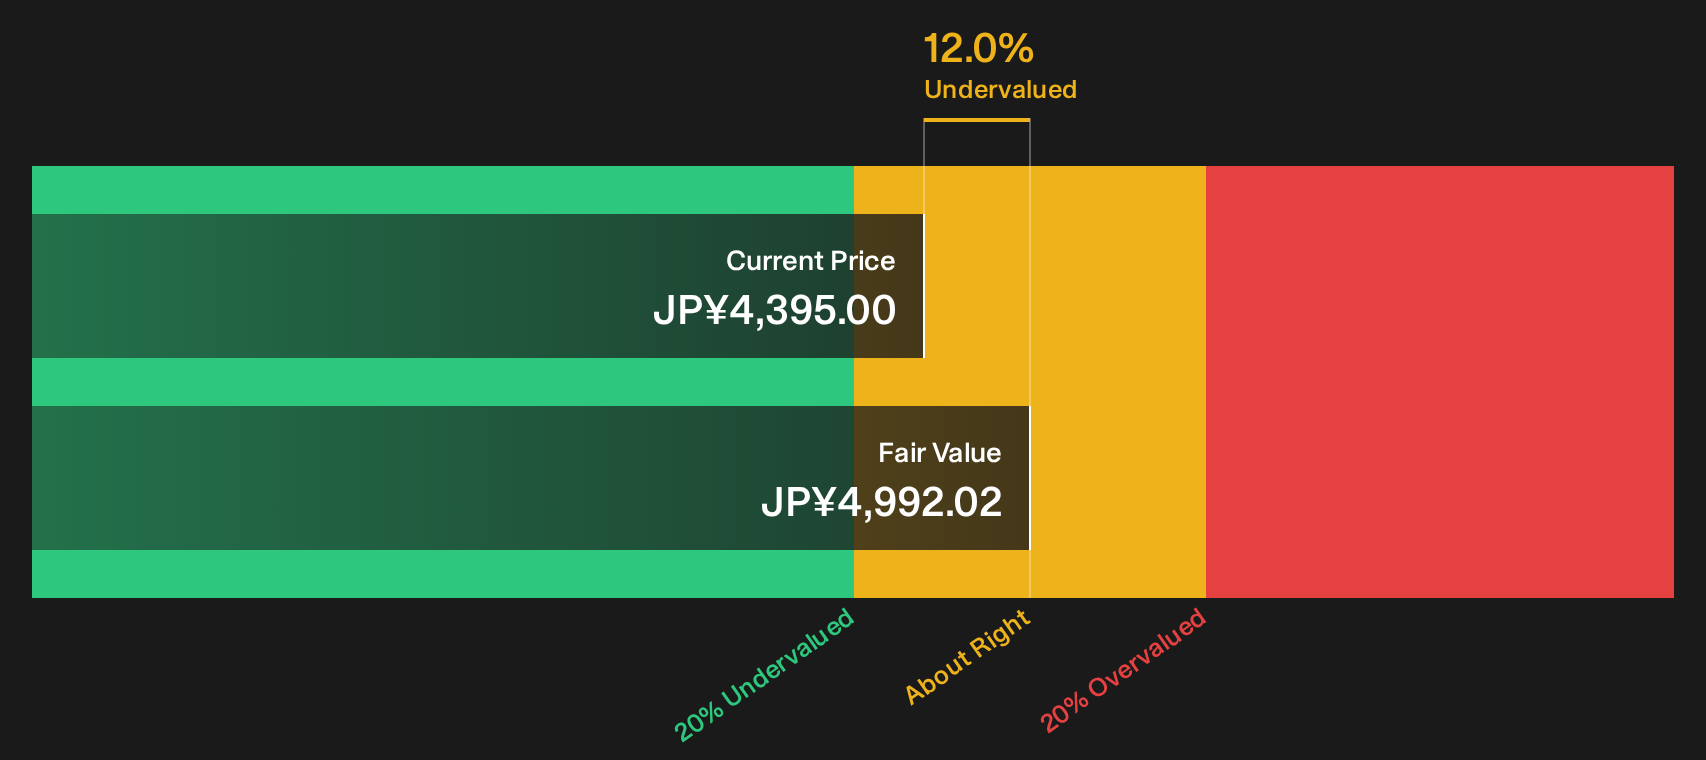
Simply Wall St performs a discounted cash flow (DCF) on every stock in the world every day (check out TISI for example). We show the entire calculation in full. You can track the result in your watchlist or portfolio and be alerted when this changes, or use our stock screener to discover 14 high quality undervalued stocks. If you save a screener we even alert you when new companies match - so you never miss a potential opportunity.
Next Steps
If this mix of optimism and caution around TISI feels familiar, lean into the data yourself and form a clear view while the story is still taking shape. To see what optimistic investors are focusing on, take a closer look at the 3 key rewards.
Looking for more investment ideas beyond TISI?
You have a clear view on TISI. The next smart move is lining up a few alternatives so you are not relying on a single storyline.
- Target quality at a discount by scanning companies that screen as both resilient and attractively priced through the 14 high quality undervalued stocks.
- Strengthen your defense with businesses that pair steady operations and healthier finances through the list of solid balance sheet and fundamentals (21 results).
- Hunt for future leaders that fewer investors are watching by filtering for resilient, under-the-radar opportunities using the 73 high quality undiscovered gems.
This article by Simply Wall St is general in nature. We provide commentary based on historical data and analyst forecasts only using an unbiased methodology and our articles are not intended to be financial advice. It does not constitute a recommendation to buy or sell any stock, and does not take account of your objectives, or your financial situation. We aim to bring you long-term focused analysis driven by fundamental data. Note that our analysis may not factor in the latest price-sensitive company announcements or qualitative material. Simply Wall St has no position in any stocks mentioned.
Have feedback on this article? Concerned about the content? Get in touch with us directly. Alternatively, email editorial-team@simplywallst.com