
- PRICING
- LIVE QUOTES
- LEARN
- HELP


EN
Wayfair (W) Stock Still Looks Below Fair Value Following Its 145% Run
Wayfair has delivered a powerful share price run in recent years, which naturally raises a sharper question for you as an investor. Is the current US$107.28 price still in line with what the retailer's cash flows can justify, or has sentiment moved ahead of the underlying economics of the business?
- Wayfair has returned 144.5% over the past 3 years, so a lot now hinges on whether that kind of share price outcome is matched by the pattern of cash the business is expected to generate.
- A recent Bernstein report highlighting potential revenue growth supported by category stability, a Rewards program, physical stores and product improvements points straight at the drivers that can shape Wayfair's future cash flows and the timing of when those flows arrive.
- Prefer to judge Wayfair on sales? See why Wayfair's 1.1x P/S tells a different valuation story.
The issue now is whether the intrinsic value suggested by its cash flows can support where Wayfair stock trades today.
If you want to stress test the same cash flow question you are asking of Wayfair across a broader watchlist, scan a set of 33 high quality undervalued stocks.
Does Wayfair Look Undervalued on Cash Flow?
The Discounted Cash Flow (DCF) approach here focuses on the cash Wayfair can return to shareholders over time. The model uses last twelve month free cash flow of about $410.2 million in $ and then ramps to projected annual free cash flows above $600 million by 2027, rising further into the next decade. That profile assumes a business that is growing its cash generation rather than staying flat or shrinking.
On those inputs, the DCF points to an estimated intrinsic value that sits substantially above the current $107.28 share price. Bernstein’s recent view that revenue could pick up through 2027, helped by Rewards, stores and product improvements, gives one narrative for why those rising cash flow projections might prove realistic. However, the market is not fully reflecting that story in the price today. You can see the full set of assumptions behind this valuation and how it compares to where the stock trades now. Find out what Wayfair could be worth using our Discounted Cash Flow (DCF) estimate.
The Wayfair Narrative: What Would Justify Today's Price?
Simply Wall St Narratives pick up where the Wayfair valuation question leaves off by spelling out the future growth, margin and earnings paths that would need to hold for the stock to be worth materially more or less than it is today, on the Community page. Rather than anchoring everything on a single multiple or headline model output, each scenario lays out the assumptions behind its fair value estimate so you can weigh those against Wayfair's actual results as they arrive.
The Wayfair community splits into two camps, with one group seeing meaningful upside and the other arguing expectations already look stretched.
Bull case: 13% undervalued
"Wayfair's proprietary logistics network, CastleGate, is expected to provide a meaningful growth unlock by improving efficiency and customer experience…"
Discover why this Narrative puts Wayfair at 13% undervalued.
Bear case: 23% overvalued
"Rising interest rates and persistent weakness in the housing market, including depressed housing turnover and flat to negative overall industry sales, could structurally limit Wayfair's addressable demand…"
Explore why this Narrative puts Wayfair at 23% overvalued.
One more unanswered question for Wayfair investors
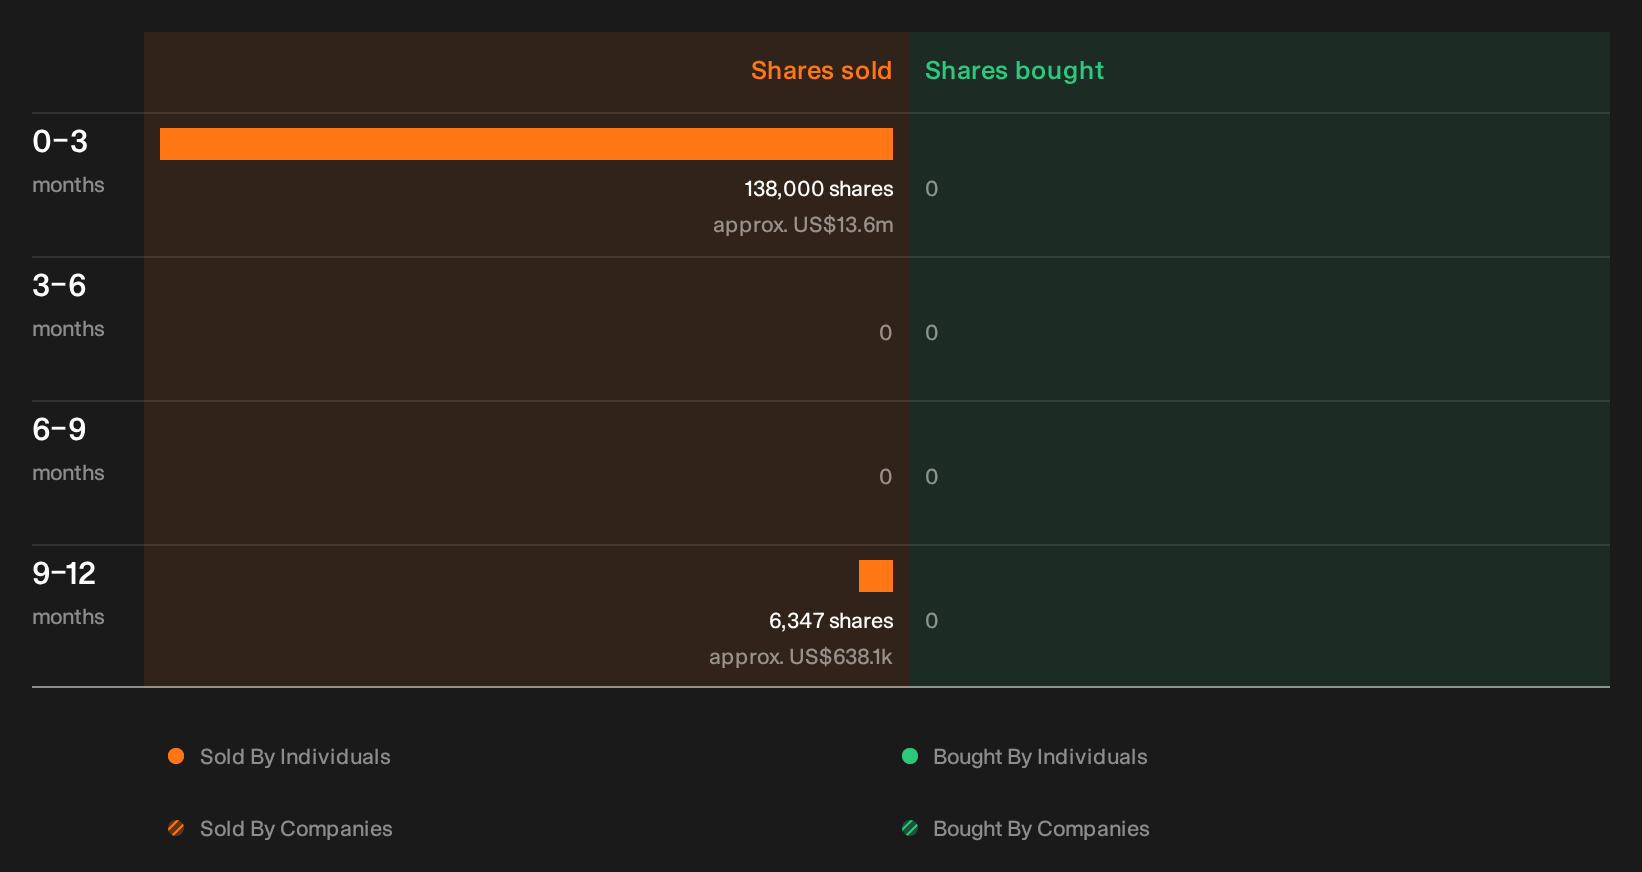
Valuation only tells part of the story for Wayfair, because recent transactions by people inside the business can send a different signal about risk and reward, and the specific sellers, sizes and possible meanings are still for you to unpack. See the recent insider selling flagged for Wayfair.
This article by Simply Wall St is general in nature. We provide commentary based on historical data and analyst forecasts only using an unbiased methodology and our articles are not intended to be financial advice. It does not constitute a recommendation to buy or sell any stock, and does not take account of your objectives, or your financial situation. We aim to bring you long-term focused analysis driven by fundamental data. Note that our analysis may not factor in the latest price-sensitive company announcements or qualitative material. Simply Wall St has no position in any stocks mentioned.
Have feedback on this article? Concerned about the content? Get in touch with us directly. Alternatively, email editorial-team@simplywallst.com