
- PRICING
- LIVE QUOTES
- LEARN
- HELP


EN
Rollins (ROL) Nears Earnings On A Pricey Narrative And A Cheaper DCF View
Rollins (ROL) heads into its upcoming earnings report with investors weighing two tensions. Expectations call for higher sales and $0.35 in quarterly EPS, yet forecasts for profit per share were trimmed slightly over the past month.
Recent trading has been rough for Rollins, with the share price down 25.9% over the past 90 days and 43.3% year to date. The 1 year total shareholder return has declined 39.2%, yet the 3 year total shareholder return remains modestly positive at 5.4%, which hints at longer term resilience despite fading near term momentum.
Compare Rollins with a curated group of service businesses that combine recurring cash flows with compressed valuations using the 33 high quality undervalued stocks for fresh ideas based on the same theme.
Rollins now trades well below recent levels, so some investors might view the slide as a potential buying window rather than staying on the sidelines. The key question is whether the current valuation already reflects the risk associated with the trimmed earnings expectations.
Most Popular Narrative: 106.5% Overvalued
On narrative-based estimates, Rollins screens as expensive. Esteban assigns a fair value of $16.20 per share, which sits well below the recent $33.45 close, so the story hinges on whether investors are paying far ahead for quality and duration.
Rollins is the dominant pure-play compounder in global pest control, a structurally necessary, recession-resistant service business that has grown revenue for 24 consecutive years and delivered ROIC in the range of 23% to 31% for 12 consecutive years, without a single year of ROIC below 21% even through COVID-19. The investment thesis rests on three mutually reinforcing pillars: (1) a Wide Moat rooted in switching costs, in which commercial customers cannot switch providers without triggering compliance risk and residential customers renew habitually at annual price increases of 3% to 4% above CPI without meaningful churn; (2) a proven M&A flywheel that converts a fragmented industry of more than 34,000 U.S. operators into compounding route density and FCF, completing 30 to 45 bolt-on acquisitions annually at disciplined multiples with zero reported impairments; and (3) a capital-light business model with minimal reinvestment needs, generating FCF of $678M in FY2025 on $3.76B of revenue.
See why 10 investors see Rollins as 106% overvalued.
Result: Fair Value of $16.20 (OVERVALUED)
Still, Rollins faces pressure if acquisition economics soften or if climate driven pest patterns shift. This could test assumptions behind long run free cash flow forecasts.
Find out about the key risks to this Rollins narrative.
Another View: Rollins Through a DCF Lens
Where Esteban’s narrative flags Rollins as expensive at $33.45 versus a $16.20 fair value, our DCF model points in the opposite direction. On Simply Wall St estimates, the shares trade about 43.4% below an implied future cash flow value of $59.09, which raises a different question. Is the market overpaying for quality, or underpricing cash generation potential?
Look into how the SWS DCF model arrives at its fair value.
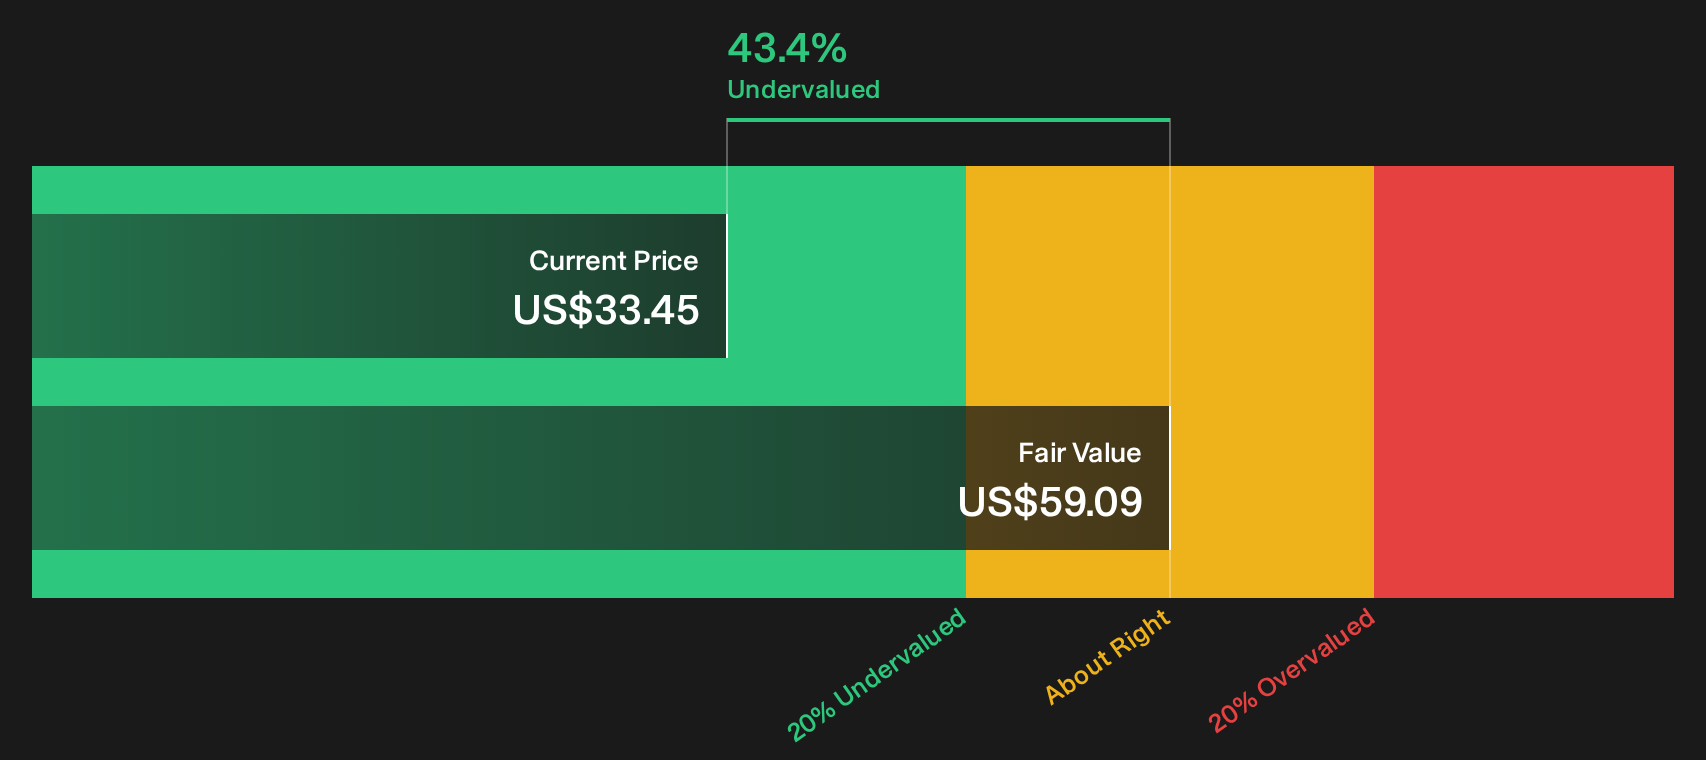
Simply Wall St performs a discounted cash flow (DCF) on every stock in the world every day (check out Rollins for example). We show the entire calculation in full. You can track the result in your watchlist or portfolio and be alerted when this changes, or use our stock screener to discover 33 high quality undervalued stocks. If you save a screener we even alert you when new companies match - so you never miss a potential opportunity.
Next Steps
Mixed messages on Rollins can leave you torn between caution and curiosity, so move quickly, check the numbers yourself, then weigh the 3 key rewards and 2 important warning signs.
Looking for more Rollins investment ideas?
Rollins shows how much a single stock story can split opinion, so balance that by lining up a few more candidates that fit your own checklist and risk limits.
- Scan for potential mispricings by reviewing the 33 high quality undervalued stocks that pair strong fundamentals with compressed expectations.
- Secure your downside first by checking out the 32 resilient stocks with low risk scores that aim to keep drawdowns in check while you focus on long term compounding.
- Hunt for tomorrow's standouts early by combing through the 20 high quality undiscovered gems before they land on every investor's radar.
This article by Simply Wall St is general in nature. We provide commentary based on historical data and analyst forecasts only using an unbiased methodology and our articles are not intended to be financial advice. It does not constitute a recommendation to buy or sell any stock, and does not take account of your objectives, or your financial situation. We aim to bring you long-term focused analysis driven by fundamental data. Note that our analysis may not factor in the latest price-sensitive company announcements or qualitative material. Simply Wall St has no position in any stocks mentioned.
Have feedback on this article? Concerned about the content? Get in touch with us directly. Alternatively, email editorial-team@simplywallst.com