
- PRICING
- LIVE QUOTES
- LEARN
- HELP


EN
Should Production Guidance Update Require Action From BP (LSE:BP.) Investors?
- BP updated its third quarter 2026 production guidance, now expecting total upstream output of 2,190 to 2,240 mboe/d, split between Oil production & operations of 1,415 to 1,445 mboe/d and Gas & low carbon energy of 775 to 795 mboe/d. The company also outlined expectations for lower net debt and stronger refining conditions.
- The combination of higher production guidance, anticipated balance sheet improvement, and solid refining and gas trading conditions points to an operating setup in which BP is leaning on core hydrocarbons and integrated trading to support earnings while managing geopolitical risks and weather-related disruptions.
- We will examine how BP's updated third quarter production outlook reshapes the existing investment narrative built around cost control and project execution.
Scan how BP's mix of hydrocarbons, trading and balance-sheet repair compares with other energy groups by running the curated 4 resilient stocks with low risk scores that keeps financial resilience front and center.
BP Investment Narrative Recap
To own BP, belief has to center on a large integrated energy group that can keep major upstream projects running, squeeze more efficiency out of refining and trading, and steadily tidy up the balance sheet. The higher third quarter 2026 production guidance and expected net debt reduction point to that operational story holding together for now rather than changing it.
The key short term swing factor is how reliably BP converts this production mix and supportive refining and gas trading backdrop into cleaner, less lumpy cash generation. Geopolitical threats to supply routes and recurring weather interruptions in the Gulf of Mexico remain the biggest operational risks that could upset that cash flow picture.
The most relevant update is BP’s expectation of a significant reduction in net debt alongside a stronger refining environment and firmer gas marketing and trading results in the third quarter of 2026. That combination matters because it frames the production uplift not just as extra volume, but as output supported by credit metrics that may be moving in a healthier direction.
For catalysts, think about that debt trajectory and refining backdrop together with the updated 2,190 to 2,240 mboe/d guidance. If BP delivers within that range while keeping working capital and one off items in check, it gives more evidence that the integrated model and cost work are translating into more resilient earnings through a period of security risks and hurricane related disruptions.
BP's current analyst narrative points to forecast revenue of $197.0b and earnings of $10.1b by 2029, based on expectations that revenue will decline by 2.9% per year and that profit will rise from $5.4b today, which implies an earnings increase of about $4.7b over that period.
Uncover why BP's fair value indicates a 4% potential upside to its current price before the market closes that valuation gap.
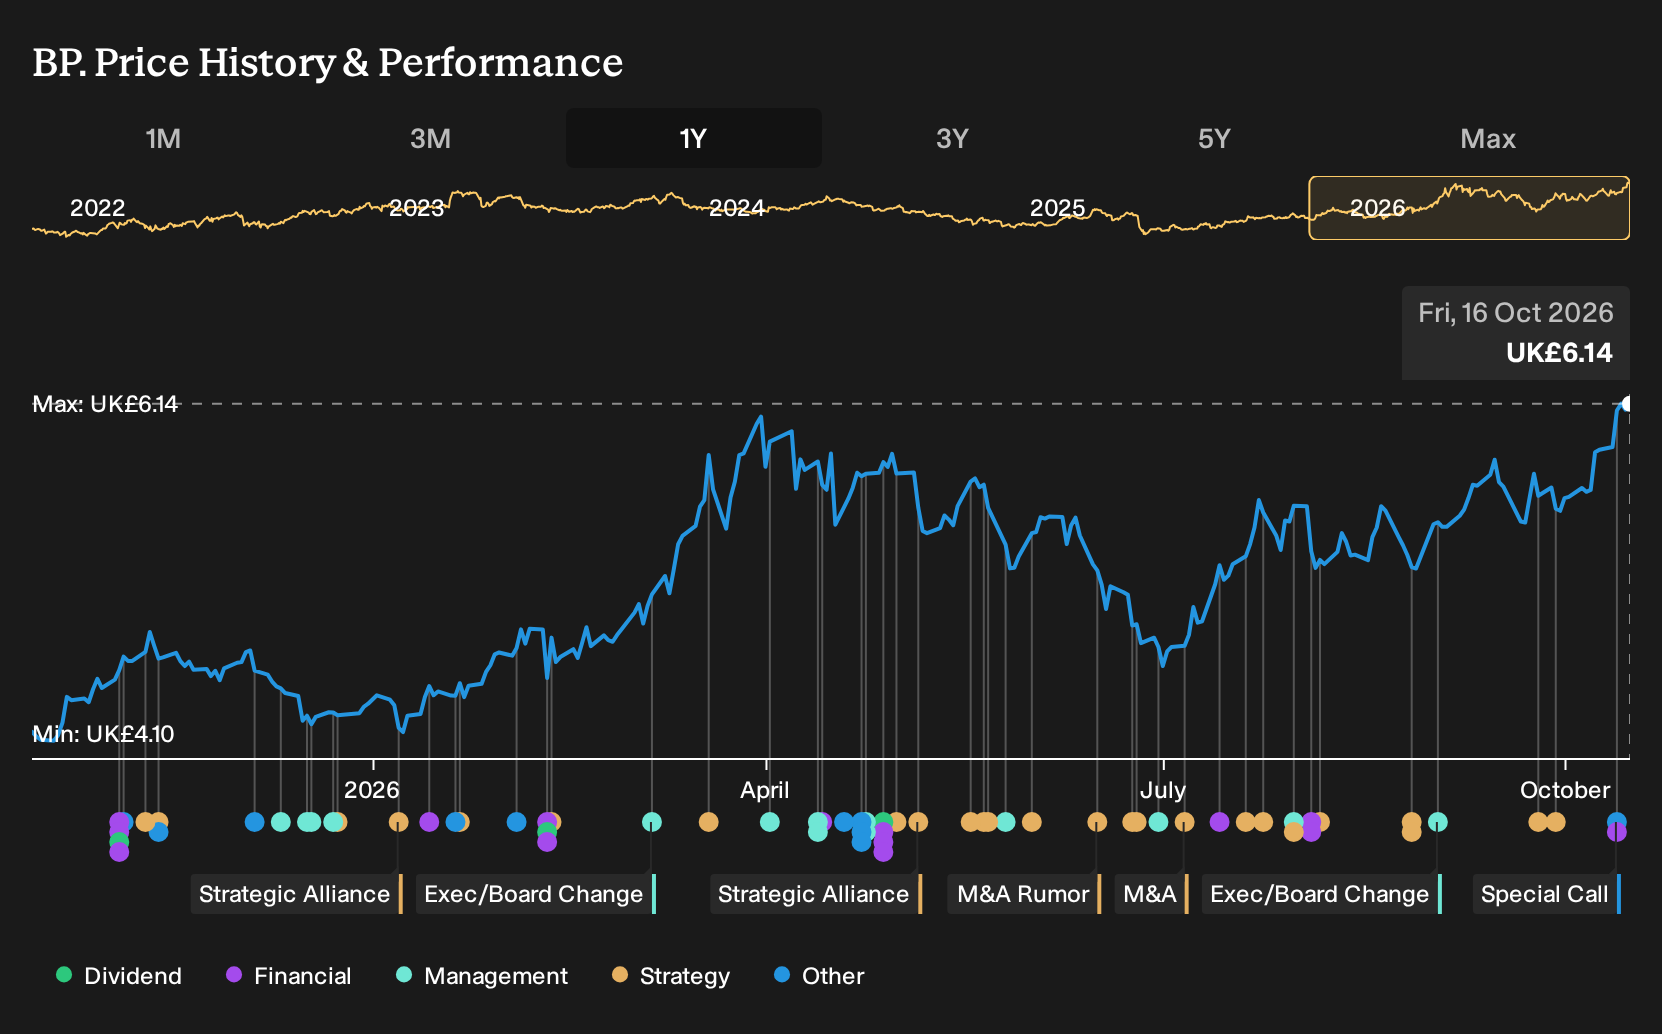
Exploring Other Perspectives
Some of the most optimistic analysts focus on BP’s big upstream resource potential, especially the Bumerangue discovery, as the real swing factor. Before this guidance update, that group was mapping out revenue of about $237.5b and earnings of $12.3b by 2029. You can compare that to the more cautious $197.0b and $10.1b path and decide which storyline feels closer to your view, keeping in mind both sets of forecasts were built before today’s production news and may well shift.
Explore 4 other BP fair value estimates, including one that suggests as much as 67% upside from the current price.
The Verdict Is Yours
Don't just follow the ticker; dig into the data and build a conviction that's truly your own.
- A great starting point for your BP research is our analysis highlighting 2 key rewards and 2 important warning signs that could impact your investment decision.
- See our latest analysis for BP. The report includes a comprehensive fundamental analysis summarized in a single visual, the Snowflake, making it easy to evaluate BP's overall financial health at a glance.
Looking For More Investment Ideas Beyond BP?
Once the BP story feels clear, it can be helpful to widen the lens and compare it with other companies that match the type of risk and return profile you want in your portfolio. The Simply Wall St Screener lets you filter for fundamentals that line up with your own checklist rather than just chasing headlines.
- If capital preservation sits high on your list, you could start with companies that score well on resilience and balance sheet strength by reviewing the 4 resilient stocks with low risk scores.
- For investors who want value on their side, it may be useful to scan for shares that combine quality fundamentals with prices that appear out of step with those metrics through the 7 high quality undervalued stocks.
- If income is your priority, you might focus on companies offering higher yields with a lens on durability by working through the 2 dividend fortresses.
This article by Simply Wall St is general in nature. We provide commentary based on historical data and analyst forecasts only using an unbiased methodology and our articles are not intended to be financial advice. It does not constitute a recommendation to buy or sell any stock, and does not take account of your objectives, or your financial situation. We aim to bring you long-term focused analysis driven by fundamental data. Note that our analysis may not factor in the latest price-sensitive company announcements or qualitative material. Simply Wall St has no position in any stocks mentioned.
Have feedback on this article? Concerned about the content? Get in touch with us directly. Alternatively, email editorial-team@simplywallst.com