
- PRICING
- LIVE QUOTES
- LEARN
- HELP


EN
Nelnet (NNI) Launches FACTS Compass On A Valuation That Already Looks Pricey
FACTS Compass and why it matters for Nelnet
Nelnet (NNI) recently saw its FACTS division roll out FACTS Compass, a platform built to help Scholarship Granting Organizations handle the Federal Scholarship Tax Credit and scholarship administration.
For context, Nelnet shares trade at US$128.02 and have gained 1.55% on a 1-day share price return and 1.64% over 7 days, while the 3-year total shareholder return of 52.40% and 5-year total shareholder return of 60.21% point to a solid longer-term payoff profile.
That mix of modest recent share price pressure over 90 days and a small decline year to date, together with positive multi year total shareholder returns, suggests investors are weighing newer products like FACTS Compass against an already established performance record rather than rapidly re rating the stock on this announcement alone.
Scan other education and financial services players that might benefit from similar scholarship and tax credit themes by reviewing the curated 20 high quality undiscovered gems list.
Nerner traders see only a small discount to estimated fair value and analyst targets after the recent move, so is that caution misplaced or exactly what Nelnet’s mix of mature units and new products deserves?
Price-to-Earnings of 15.2x: Is it justified for Nelnet?
Nelnet trades on a P/E of 15.2x, which places a clear premium on the $128.02 share price compared with several benchmarks and raises a valuation question for anyone following the stock.
The P/E ratio compares what investors pay for each dollar of current earnings. For a diversified financial group like Nelnet with loan servicing, education technology and payments, and asset management, that single number captures how the market weighs its earnings mix, regulatory exposure, and growth profile in one snapshot.
Here the premium is hard to ignore. The 15.2x P/E is higher than the peer average of 9.5x and above the US Consumer Finance industry at 8.7x, so the market is paying a materially richer price for Nelnet’s earnings than for sector alternatives. Against an estimated fair P/E of 9.7x, the current multiple also sits well above a level the SWS model suggests the market could move towards if expectations were to cool.
Explore the SWS fair ratio for Nelnet.
Result: Price-to-Earnings of 15.2x (OVERVALUED)
Still, Nelnet’s richer P/E could reset quickly if scholarship tax credit demand disappoints or if loan servicing and asset management earnings fall short of expectations.
Find out about the key risks to this Nelnet narrative.
Another View on Nelnet’s valuation
The SWS DCF model points in a very different direction. On that framework, Nelnet’s estimated future cash flow value sits at $20.54 per share, well below the current $128.02 price. This frames the stock as heavily overvalued and raises a simple question: Which lens do you trust more, earnings today or long run cash generation?
Look into how the SWS DCF model arrives at its fair value.
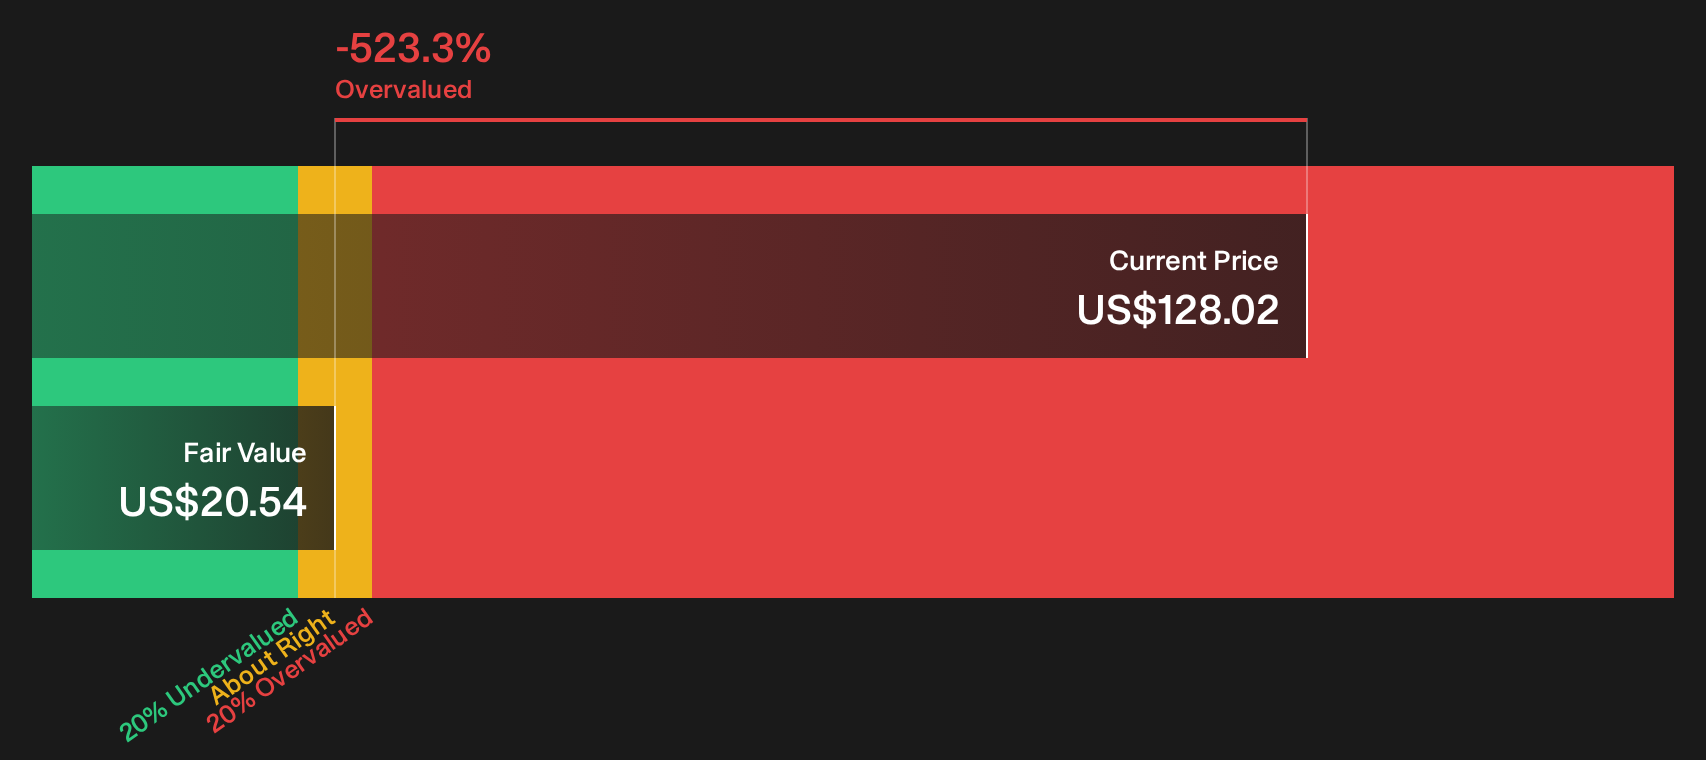
Simply Wall St performs a discounted cash flow (DCF) on every stock in the world every day (check out Nelnet for example). We show the entire calculation in full. You can track the result in your watchlist or portfolio and be alerted when this changes, or use our stock screener to discover 33 high quality undervalued stocks. If you save a screener we even alert you when new companies match - so you never miss a potential opportunity.
Next Steps
Mixed signals on Nelnet’s valuation and product momentum do not need to leave you on the fence. Act while the facts are fresh and pressure test the upside against the downside with 1 key reward and 1 important warning sign
Looking for more investment ideas beyond Nelnet?
Do not stop with Nelnet. Use this moment of focus to widen your watchlist and pressure test other opportunities before the next round of headlines hits.
- Target resilient balance sheets and steady fundamentals by scanning the list of solid balance sheet and fundamentals (25 results) that already meet strict financial health filters.
- Hunt for potential value opportunities by checking the 33 high quality undervalued stocks that pair stronger balance sheets with attractive pricing signals.
- Prioritise resilience over drama by reviewing the 32 resilient stocks with low risk scores that score well on Simply Wall St's risk checks.
This article by Simply Wall St is general in nature. We provide commentary based on historical data and analyst forecasts only using an unbiased methodology and our articles are not intended to be financial advice. It does not constitute a recommendation to buy or sell any stock, and does not take account of your objectives, or your financial situation. We aim to bring you long-term focused analysis driven by fundamental data. Note that our analysis may not factor in the latest price-sensitive company announcements or qualitative material. Simply Wall St has no position in any stocks mentioned.
Have feedback on this article? Concerned about the content? Get in touch with us directly. Alternatively, email editorial-team@simplywallst.com