
- PRICING
- LIVE QUOTES
- LEARN
- HELP


EN
Wesdome Gold Mines (TSX:WDO) Released Third Quarter Production Results, Is The Valuation Gap Justified?
Wesdome Gold Mines (TSX:WDO) just released new third quarter production numbers, giving you an updated view of how its Canadian gold operations are performing in real time.
That production update landed alongside a sharp 6.10% 1-day share price return, taking Wesdome Gold Mines to CA$31.65, even though the 7-day and 30-day share price returns are down 5.83% and 6.53% as traders reassess near term output and risk.
Scan how Wesdome Gold Mines compares with other producers by lining it up against our curated list of 35 elite gold producer stocks for potential ideas beyond this single ticker.
Wesdome Gold Mines has already logged a strong year on the chart, yet the latest pullback after softer production leaves a different puzzle. Is most of the easy upside already gone, or does the valuation still leave room?
Preferred Price-to-Earnings for Wesdome Gold Mines: Is it justified?
Wesdome Gold Mines is trading on a P/E of 10.9x, which sits below both its estimated fair P/E of 17.5x and the Canadian Metals and Mining sector average of 14.7x, even though it is slightly above the peer group average of 10.5x.
The P/E ratio compares the current share price to earnings per share and, for a producer like Wesdome Gold Mines, it effectively indicates how much investors are paying today for each dollar of profit. For a miner with an existing production base and earnings already in place, this measure often becomes a quick shorthand for how the market is weighing current profitability against forecast output and commodity price risk.
With earnings forecast to grow 18.04% per year and revenue expected to rise 13.9% per year according to the supplied estimates, a P/E of 10.9x suggests the market is assigning a relatively restrained price tag to those projected profits compared with the 17.5x level implied by the fair P/E estimate. The gap between the current multiple and that fair ratio level could be read as a sign that expectations for those forecasts remain conservative.
Against the broader Canadian Metals and Mining industry average multiple of 14.7x, Wesdome Gold Mines trades on a meaningfully lower valuation, while only modestly above the narrower peer average of 10.5x. That combination points to a stock that is priced cheaply relative to the wider industry but already closer to what similar sized rivals are getting in the market. This leaves the fair P/E of 17.5x as a higher bar the valuation could move toward if sentiment or forecasts shift.
Explore the SWS fair ratio for Wesdome Gold Mines.
Result: Price-to-Earnings of 10.9x (UNDERVALUED)
Still, Wesdome Gold Mines relies entirely on Canadian assets. Any operational issues at Eagle River or Kiena, or a weaker gold price, could quickly challenge that valuation gap.
Find out about the key risks to this Wesdome Gold Mines narrative.
Another View on Wesdome Gold Mines Using Our DCF Model
The P/E points to a restrained price tag, yet our DCF model paints a very different picture. At CA$31.65, Wesdome Gold Mines is assessed as trading about 55.3% below an estimated future cash flow value of CA$70.81, which implies a much deeper discount than earnings multiples alone suggest.
DCF work leans heavily on long term assumptions about output, gold prices and costs, while the P/E ratio leans on current earnings and near term sentiment. When those two yardsticks disagree this much, which one do you trust more for your own process?
Look into how the SWS DCF model arrives at its fair value.
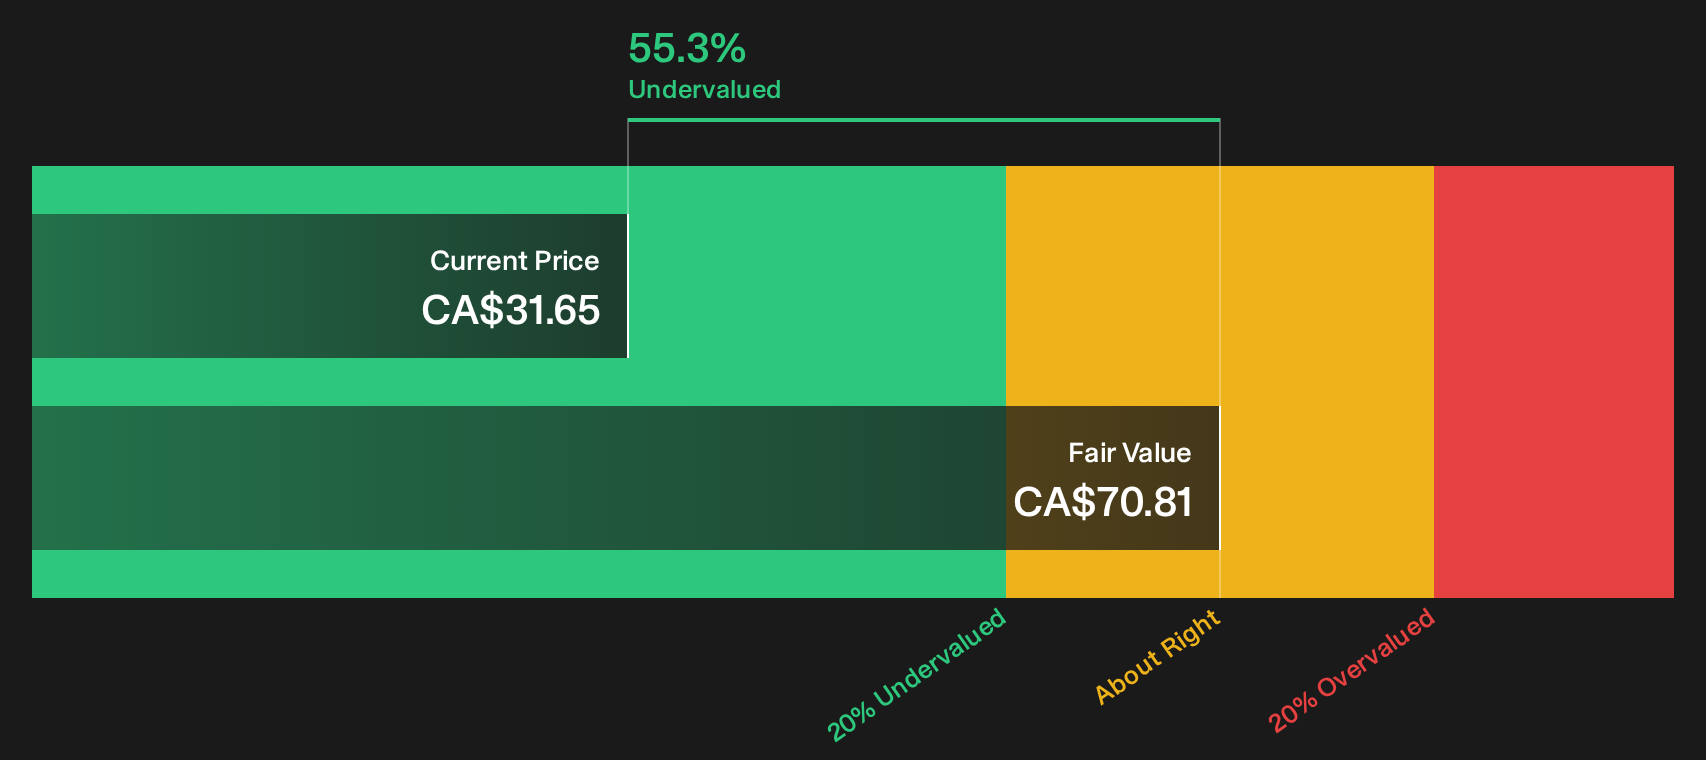
Simply Wall St performs a discounted cash flow (DCF) on every stock in the world every day (check out Wesdome Gold Mines for example). We show the entire calculation in full. You can track the result in your watchlist or portfolio and be alerted when this changes, or use our stock screener to discover 6 high quality undervalued stocks. If you save a screener we even alert you when new companies match - so you never miss a potential opportunity.
Next Steps
Sentiment around Wesdome Gold Mines is mixed, so treat this as a prompt rather than a verdict and pressure test the numbers yourself before forming a stance. To see what aspects of the business analysts view as strengths, review the 3 key rewards
Looking for more investment ideas beyond Wesdome Gold Mines?
If Wesdome Gold Mines has your attention today, do not stop there. Use this momentum to widen your universe and pressure test fresh opportunities.
- Target smaller high-conviction opportunities before they move by scanning our hand picked pool of 18 elite penny stocks with strong financials that already clear strict quality filters.
- Lock in on businesses where price and fundamentals are still out of sync using the curated set of 6 high quality undervalued stocks filtered for quality and resilience.
- Balance your watchlist with potential stability by reviewing a focused 8 resilient stocks with low risk scores that screens for stronger balance sheets and lower risk profiles.
This article by Simply Wall St is general in nature. We provide commentary based on historical data and analyst forecasts only using an unbiased methodology and our articles are not intended to be financial advice. It does not constitute a recommendation to buy or sell any stock, and does not take account of your objectives, or your financial situation. We aim to bring you long-term focused analysis driven by fundamental data. Note that our analysis may not factor in the latest price-sensitive company announcements or qualitative material. Simply Wall St has no position in any stocks mentioned.
Have feedback on this article? Concerned about the content? Get in touch with us directly. Alternatively, email editorial-team@simplywallst.com