
- PRICING
- LIVE QUOTES
- LEARN
- HELP


EN
Rithm Capital (RITM) Could Be 34% Undervalued On Its $375 Million Securitization
Rithm Capital (RITM) has priced a $375 million securitization through its Genesis Capital subsidiary, backed entirely by multifamily loans and described as the largest residential transition deal of its kind.
Recent trading tells a mixed story. Rithm Capital’s share price is up 4.31% over the past day and 1.04% across the last week, yet it is down 8.99% over 30 days and 20.67% year to date. However, the 3 year total shareholder return of 27.57% and 5 year total shareholder return of 26.83% point to more constructive longer term outcomes.
Compare Rithm Capital’s securitization move with other real estate focused opportunities and scan a hand picked list of list of solid balance sheet and fundamentals (25 results) for potential candidates in the same space.
The securitization highlights real activity in Rithm Capital’s lending engine, while the share price tells a more cautious story. Is the recent move a business shift or just sentiment resetting the valuation?
Most Popular Narrative: 34% Undervalued
Rithm Capital last closed at $8.71, while the most followed narrative anchors fair value at $13.15. This creates a wide gap that hinges on fee based earnings, servicing scale, and execution on cost savings.
Technology and AI driven cost initiatives across Newrez, including expectations to move cost per loan to roughly 50% below industry averages and to cut servicing cost per loan to $93 with more than $65 million of annual savings after the Valon migration in early 2027, are aimed at expanding net margins and supporting future ROE.
See why 74 investors see Rithm Capital as 34% undervalued.
Result: Fair Value of $13.15 (UNDERVALUED)
Still, this narrative can crack if higher funding costs bite into returns, or if mortgage competition squeezes Rithm Capital’s servicing and origination economics harder than expected.
Find out about the key risks to this Rithm Capital narrative.
Another View: What Rithm Capital’s P/E Is Really Saying
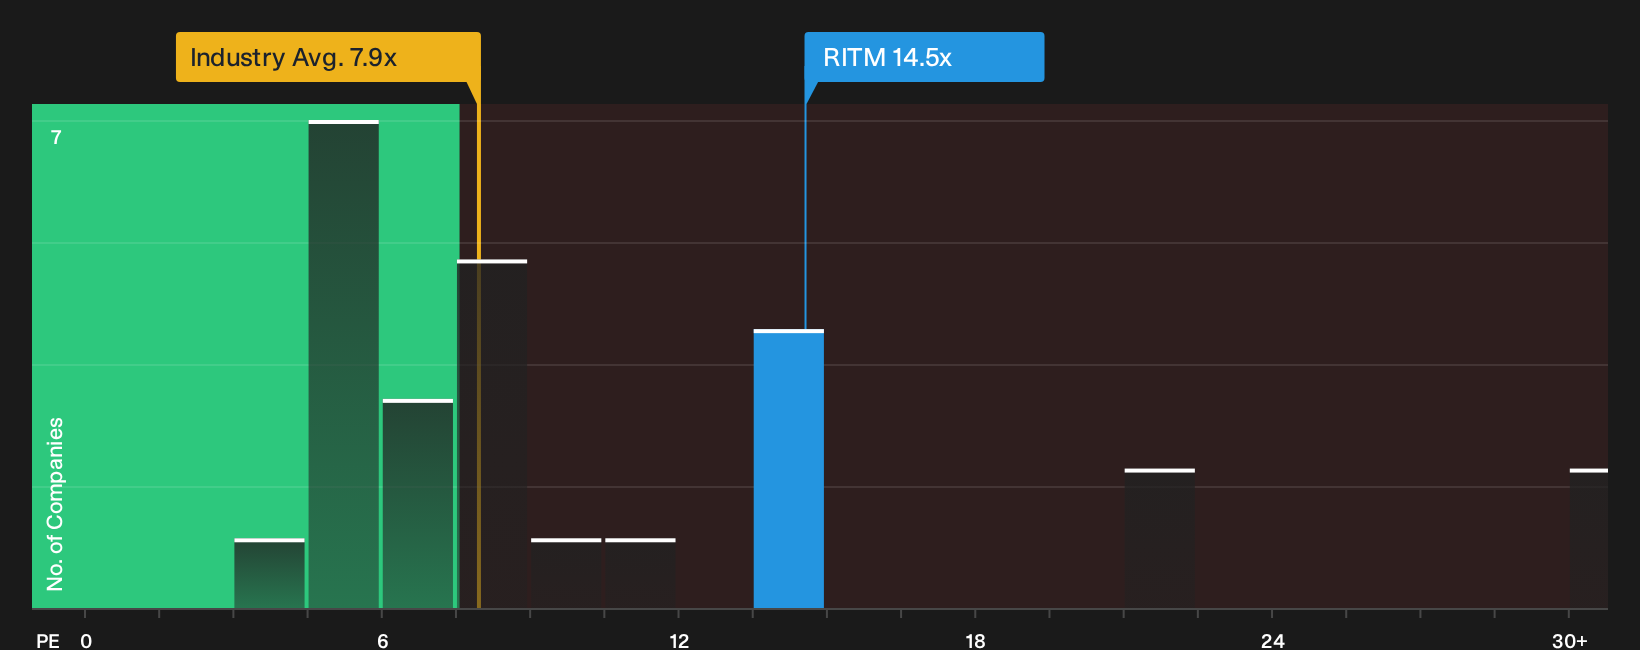
Rithm Capital screens as undervalued on fair value estimates, yet its 14.5x P/E is almost double the US Mortgage REITs industry at 7.8x and well below peers at 38.3x. The fair ratio of 19.2x suggests the market could shift either way. Which crowd do you trust more?
This is where comparing that current P/E to the fair ratio and peers can help you weigh whether you see more valuation risk or potential opportunity, and how it fits alongside other holdings in your portfolio. See what the numbers say about this price — find out in our valuation breakdown.
For a clearer visual on how Rithm Capital trades against the wider sector and where that gap sits today, see the latest valuation chart for its earnings multiple.
Next Steps
Mixed signals on value and risk can feel like a lot to process, so move quickly from headline takes to your own evidence based view by weighing the 3 key rewards and 3 important warning signs.
Looking for more Rithm Capital sized ideas?
If you stop with Rithm Capital, you miss the wider opportunity set. Use the Simply Wall St Screener to quickly surface other stocks that fit your style.
- Target resilient returns by focusing on balance sheet strength through the 32 resilient stocks with low risk scores, which filters for sturdier businesses when conditions get choppy.
- Jump on potential mispricings by scanning the 20 high quality undiscovered gems, which highlights quality companies the broader market may be overlooking right now.
- Lock in portfolio income potential by reviewing the 8 dividend fortresses, which spots higher yielding stocks with more robust fundamentals behind their payouts.
This article by Simply Wall St is general in nature. We provide commentary based on historical data and analyst forecasts only using an unbiased methodology and our articles are not intended to be financial advice. It does not constitute a recommendation to buy or sell any stock, and does not take account of your objectives, or your financial situation. We aim to bring you long-term focused analysis driven by fundamental data. Note that our analysis may not factor in the latest price-sensitive company announcements or qualitative material. Simply Wall St has no position in any stocks mentioned.
Have feedback on this article? Concerned about the content? Get in touch with us directly. Alternatively, email editorial-team@simplywallst.com