
- PRICING
- LIVE QUOTES
- LEARN
- HELP


EN
3 Reasons QQQ Could Fall 10% Soon, and 1 Reason It Could Rally Into 2027
For every $100 I risk to try to earn a return above bonds held to maturity, how much of that am I prepared to lose?
My longtime motto has been “play offense and defense at the same time.” Part of that is “taking big shots… with small amounts of money.” In my experience working with many different types of DIY investors, they tend to focus on what they can make and not much else.
This worries me, especially when I see warnings that bad things are about to happen and regret is about to replace FOMO. So, let’s take a look under the hood and explore those warning signs.
First, I’ll present the one piece of historical evidence that points to potentially better times ahead. This is late 1999 through 2000. I show the Invesco QQQ Trust (QQQ), the 10-year US Treasury Bond yield, and the CBOE Volatility Index ($VIX), one on top of the other.
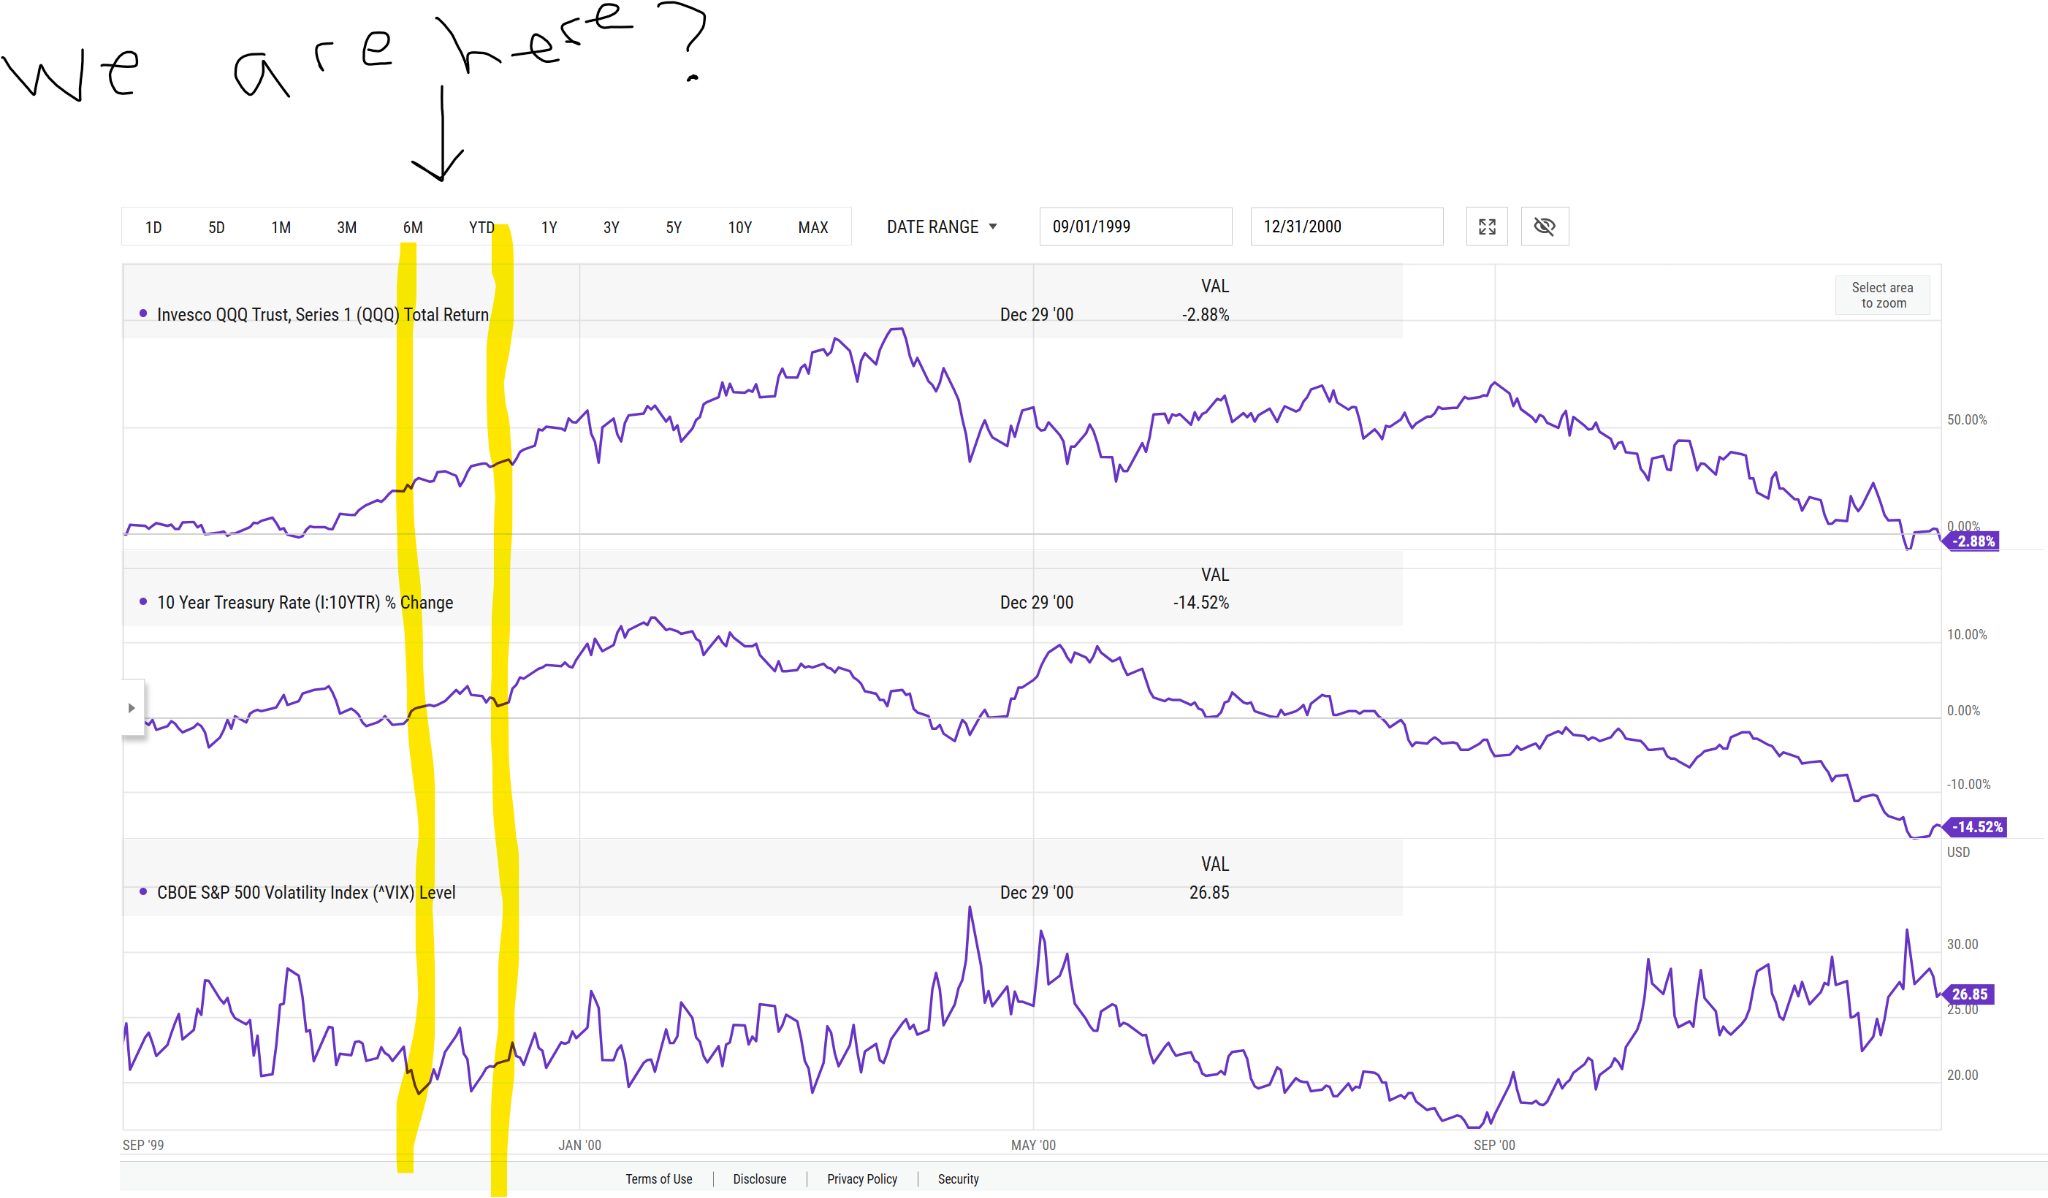
I tried to determine the “best fit” combination of the three market indicators. That is, what point in this time frame did they line up with what I see today. That’s the area between the pair of yellow lines.
As of this writing, as in late 1999, QQQ was hinting at rolling over. But it didn’t. In fact, it went on a face-ripping rally through March 2000. If that looks like it is going to happen again, I’ll be first in line to buy out-of-the-money call options to try to add a zero to my ledger!
As for the 10-year yield, it has spiked up recently, as it did back then. It doesn’t appear to be done rising, so it could fall in line with that late 1999-2000 era. If that happens, we’d see yields top out early next year.
And the VIX, the toughest one lately since it has seemed impervious to a gradually slipping stock market. Back in late 1999, VIX was toward the low end of its trading range, as it is today. That allowed QQQ to drift higher, bringing yields up with it, and VIX indicated a market that was still yawning, not panicking.
Now that the bull case is out of the way, I want to explore a trio of situations I see in the charts that make me think the more likely move of consequence is down, not up.
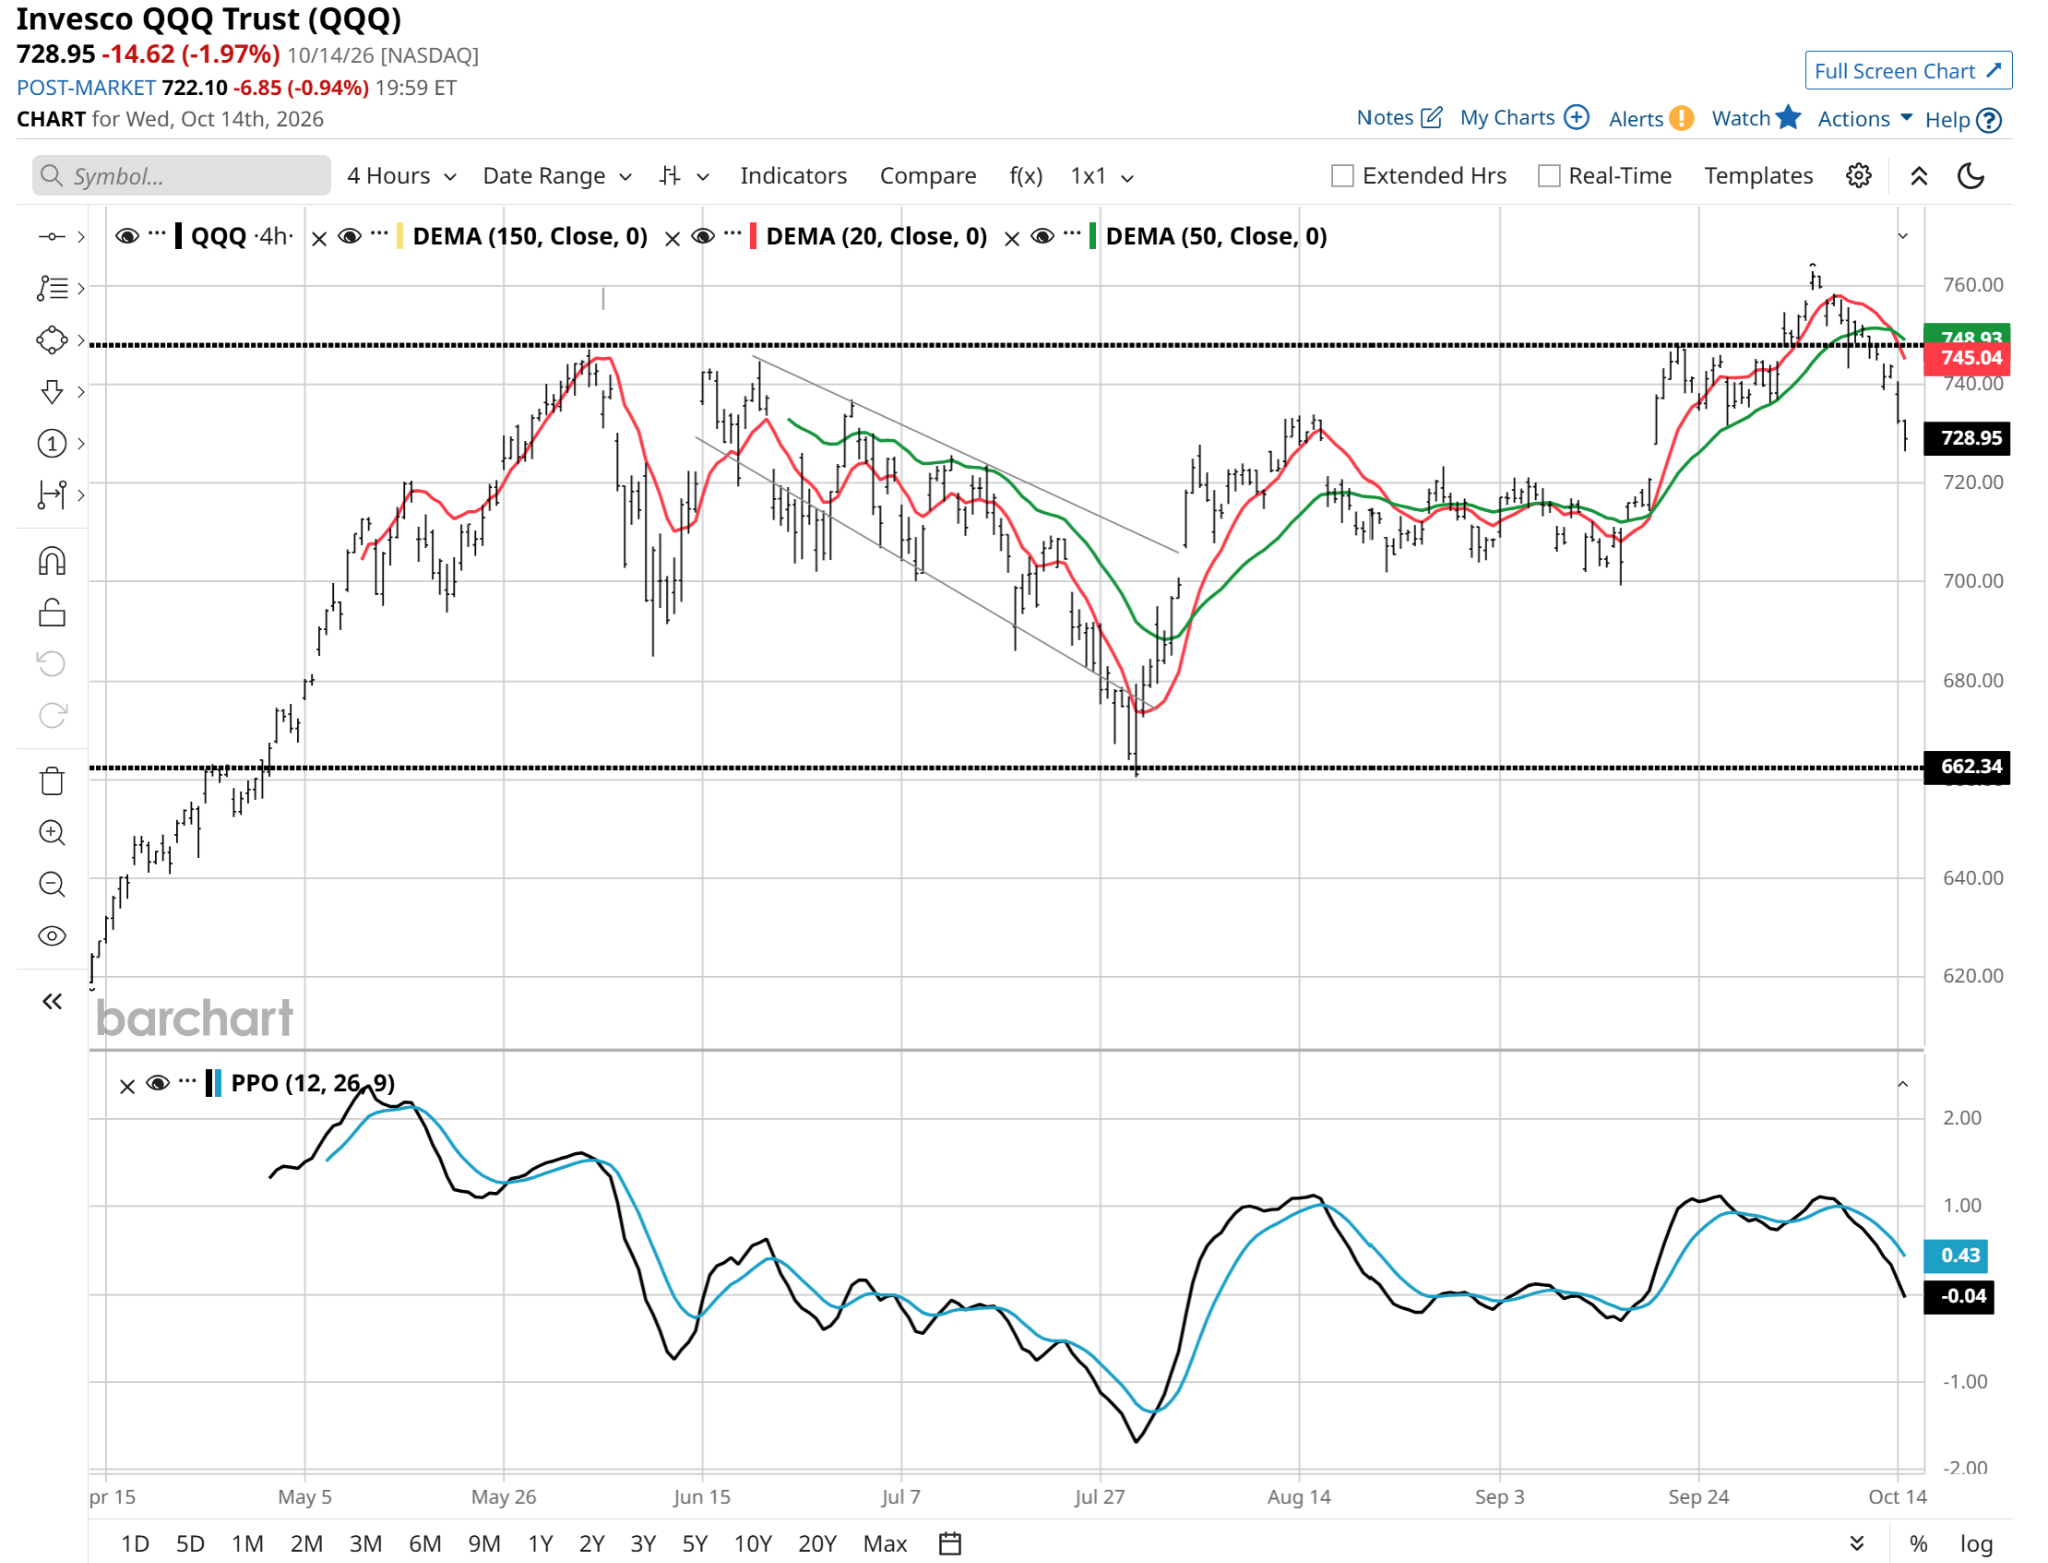
Reason one is that the percentage price oscillator (PPO) momentum indicator has bled all the way out to the 4-hour chart. Here’s the past six months on that measure. I see a downward trend, which followed a nice upside breakout in late July. Which tagged $760, but is now threatening to knock $100 points off that level. To start, at least.
The second strike against QQQ is the potential for the AI trade to unravel with lightning speed. I’m showing you the top holdings in QQQ ranked by market capitalization. But my eyes go right to the P/E multiples.
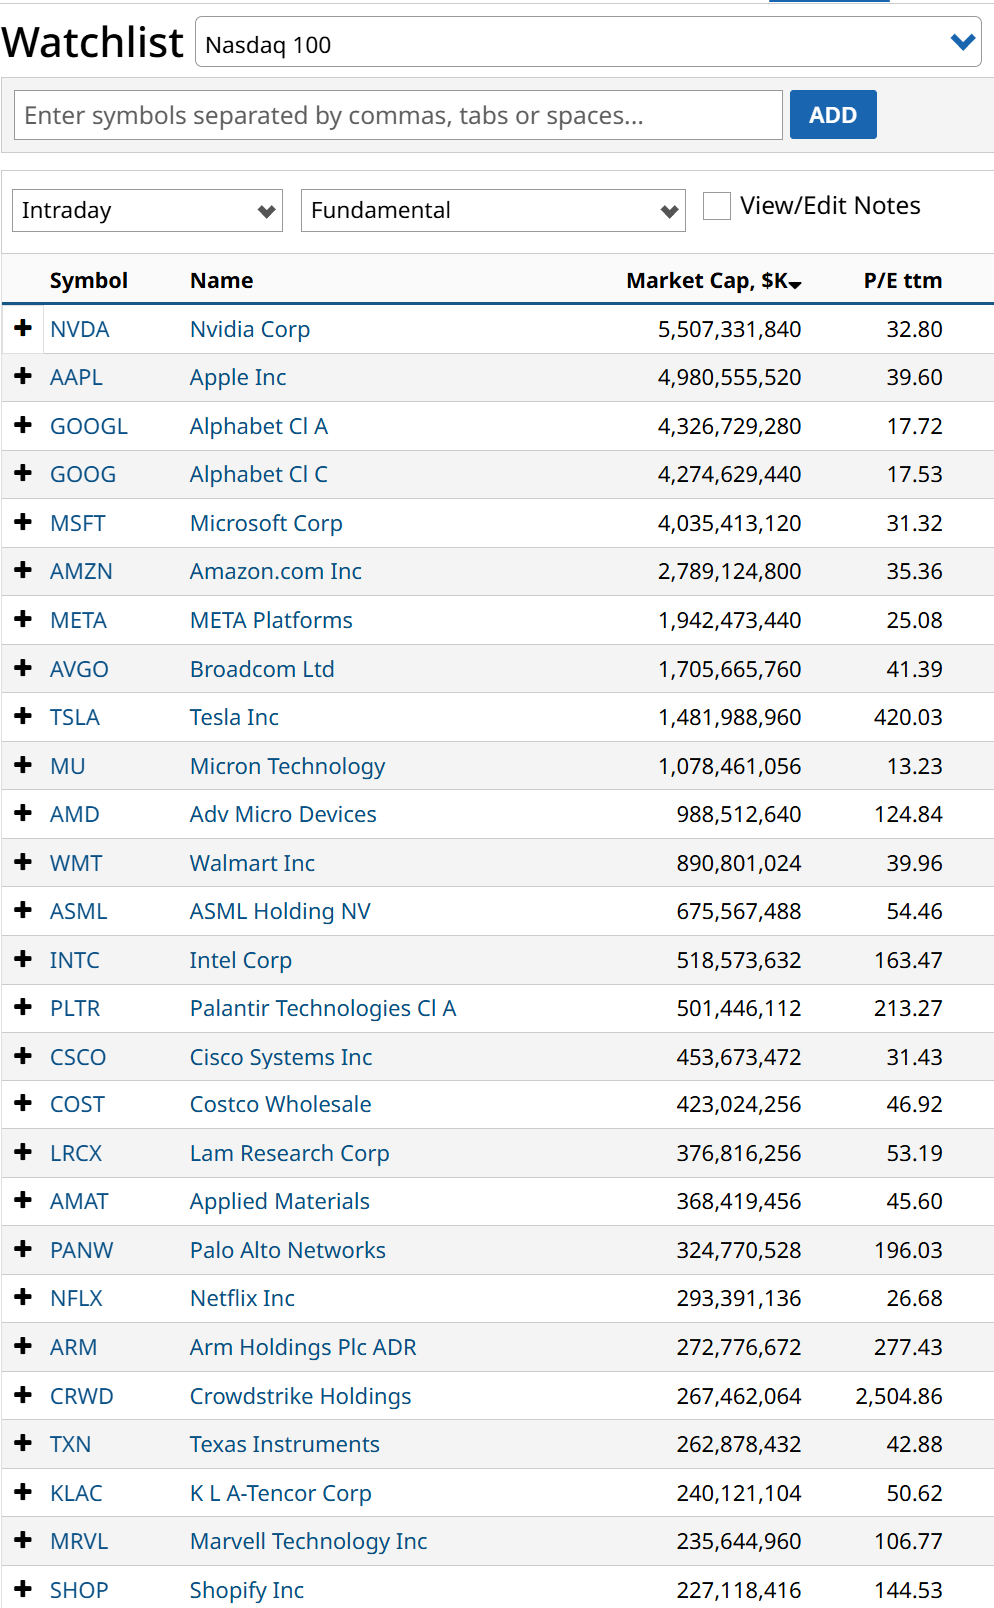
What I see is a combination of modest multiples in some big stocks, which are potentially suppressed by the historic sales of AI-related infrastructure. If that doesn’t sustain itself, those multiples will creep up quickly.
The issue would then be that there’s nothing cheap behind those. Or even close to cheap, in fact. Lots of 35x-50x data points there.
Finally, here’s my bread-and-butter daily chart going back two years. The PPO is concerning, as it appears to have just had a false start higher and is rolling over again. Maybe that’s the last attempt for AI stocks to carry the whole market? We’ll see.
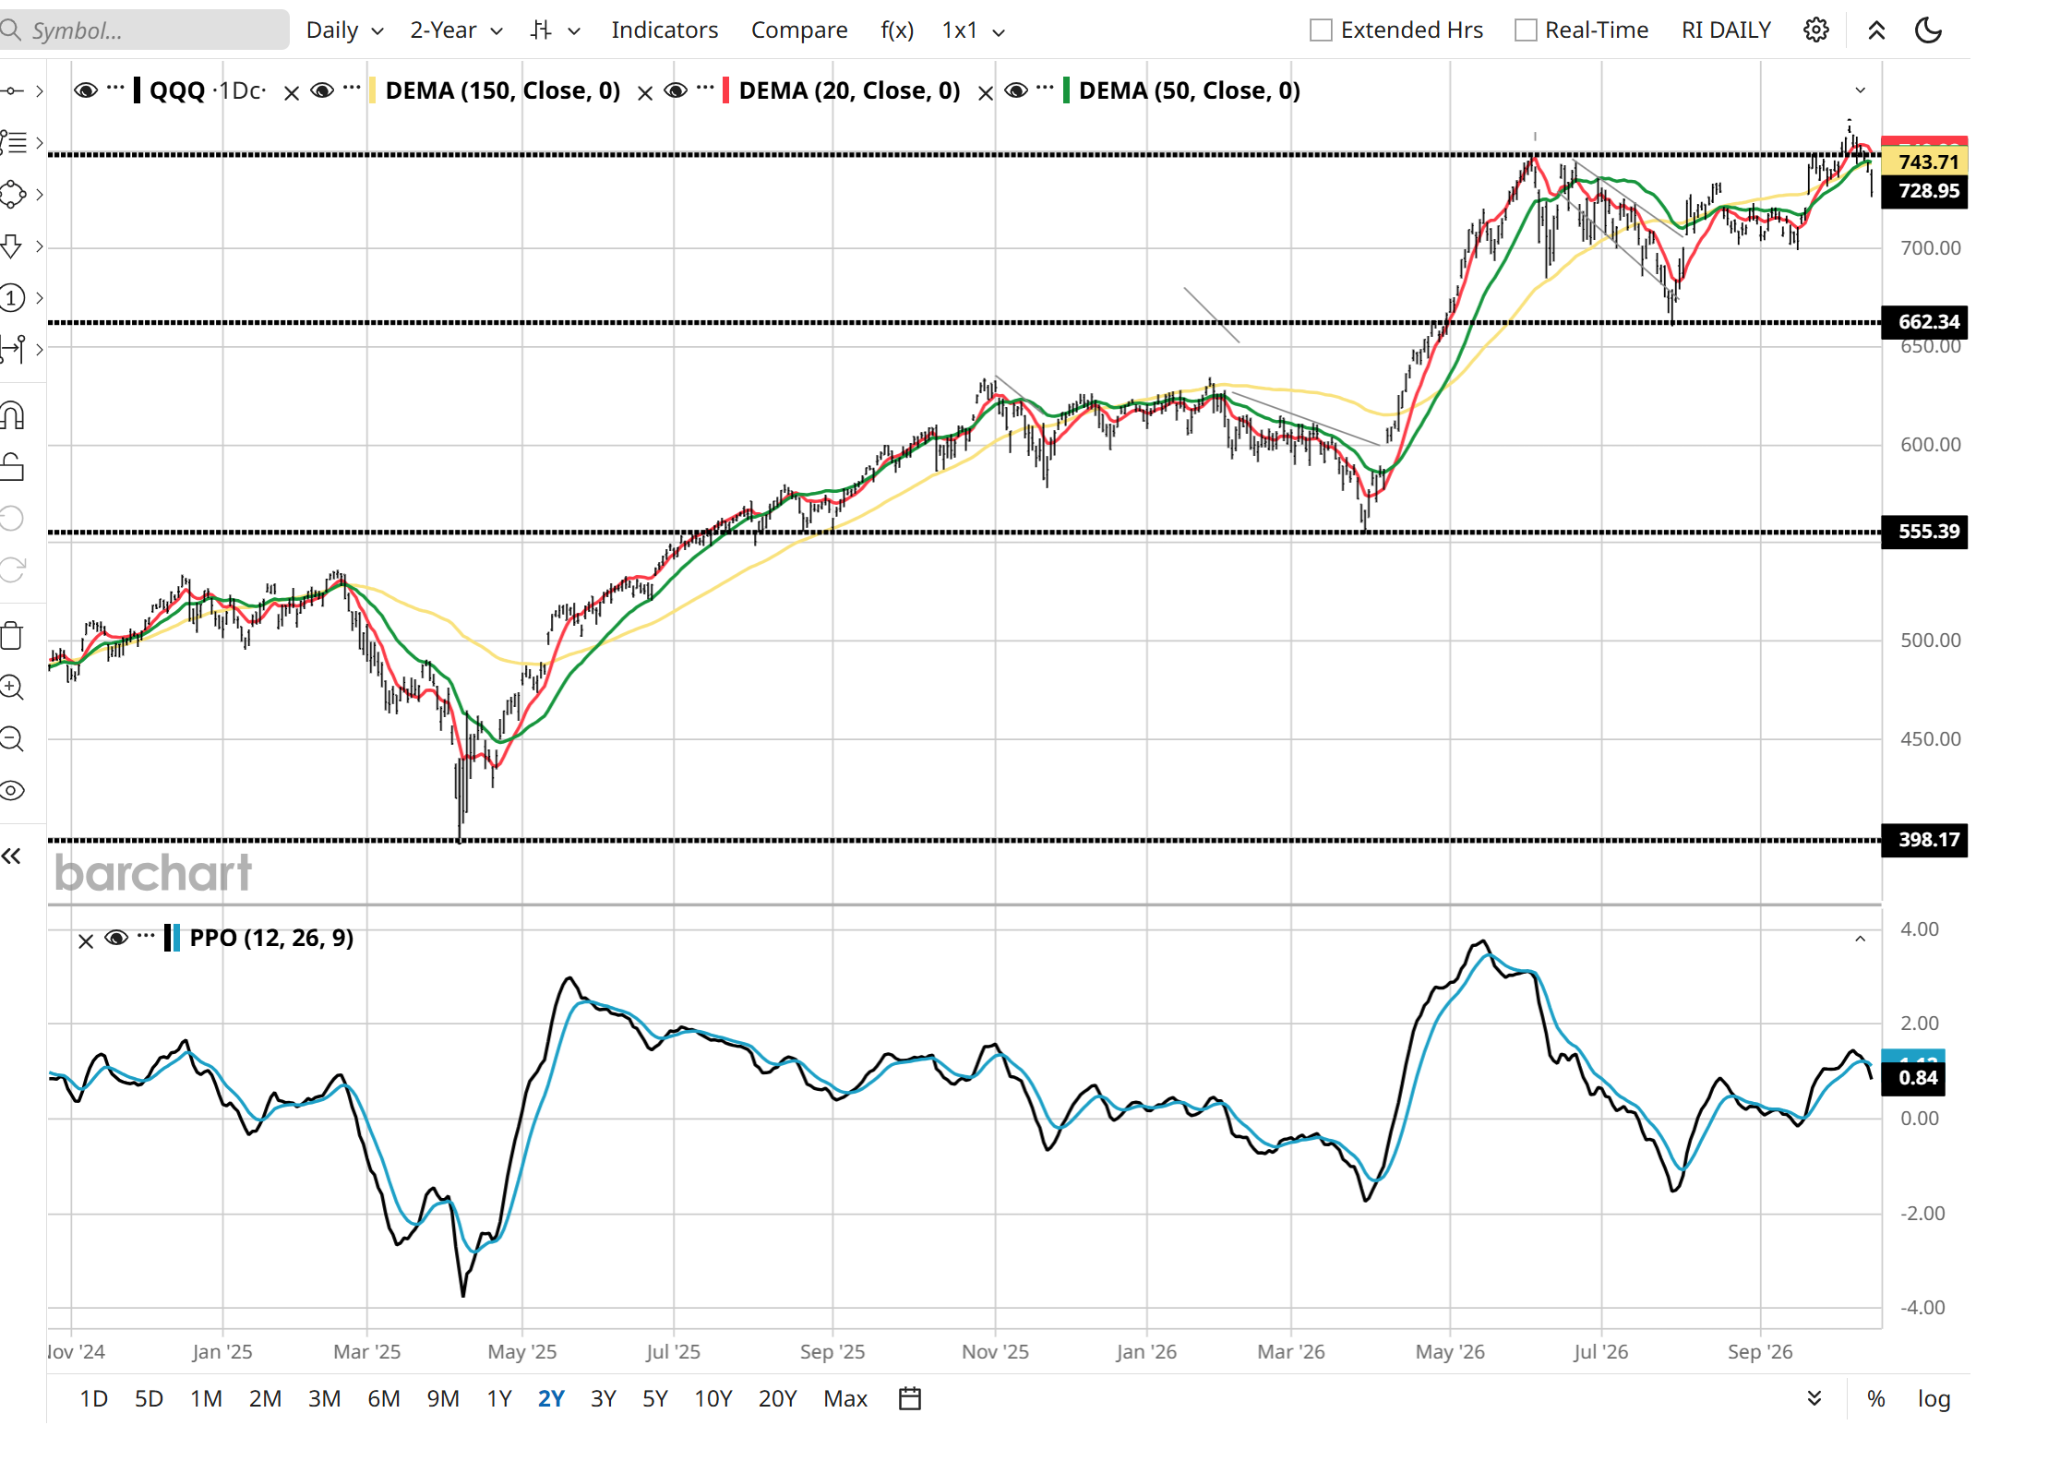
The bigger concern to me, technically speaking, is the price trend itself. It is peeling off its high, which would not be a big deal. Except that the targets lower, as I’ve labeled via those horizontal lines, are a quick support at $660, as alluded to above. And another one that, if it occurs, would make this a very memorable next 3-6 months.
That lower target is $555. That would represent a more than 25% move down off the all-time high. But then look below. Hitting $555 would be a key level to hold, given QQQ based there each of the last two years. We were just there in April, six months ago, so that level is very much in play.
Next stop if that doesn’t solve the problem. $398 ($400 if we just want to round it). That’s nearly a 50% drop. However, if that sounds impossible, it is precisely the magnitude of QQQ’s dive during the 2008-2009 global financial crisis. That, on top of a more than 70% decline back during the dot-com bubble.
If this runs amok, how does one capitalize on it? My go-to is either put options on QQQ, or since those quickly get expensive in a downturn, I opt for inverse ETFs that essentially track QQQ. But in the opposite direction.
The ProShares Short QQQ (PSQ) ETF does it in -1x fashion, and the ProShares UltraPro Short QQQ (SQQQ) ETF is a 3x inverse leveraged ETF.
Rob Isbitts is a semi-retired CIO, former fiduciary investment advisor, Barchart columnist, and straight-talker. Download his new free e-book on hedged bond investing for retirement at ETFYourself.com. His research and model portfolios are at ROAR.PiTrade.com.
On the date of publication, Rob Isbitts did not have (either directly or indirectly) positions in any of the securities mentioned in this article. All information and data in this article is solely for informational purposes. For more information please view the Barchart Disclosure Policy here.