
- PRICING
- LIVE QUOTES
- LEARN
- HELP


EN
SECOM (TSE:9735) Wraps Up Its Buyback, Is The Stock Expensive Or Undervalued?
SECOM (TSE:9735) has wrapped up a sizeable share buyback, repurchasing 9,761,600 shares, or 2.43% of outstanding stock, for ¥63,279.44 million under the program announced on 12 May 2026.
SECOM shares have picked up short term momentum, with a 1-day share price return of 2.57% and a 7-day gain of 5.36%. The 30-day move of 4.40% contrasts with a modest 90-day decline of 1.23% and a much stronger 20.32% year to date share price return and 31.30% total shareholder return over 12 months. This suggests recent buyback activity is contributing to building, rather than fading, momentum around the stock.
Scan beyond SECOM's buyback momentum and compare it with other companies that show resilient fundamentals and cash generation in our curated 16 high quality undervalued stocks list.
SECOM has already booked strong 1 year gains, yet the recent buyback and the valuation gap to analyst targets suggest that the story might not be fully priced in. How much upside do you think is actually left?
Preferred P/E of 23.9x for SECOM: Is it justified?
SECOM trades on a P/E of 23.9x, which is high compared with both its Commercial Services peers and the broader industry, even though the SWS DCF model points to the shares trading at an 8.2% discount to an estimated future cash flow value of ¥7,260.98 versus the last close of ¥6,662.
The P/E ratio compares the current share price to earnings per share and gives a quick sense of how much investors are paying for each unit of profit. For a diversified security and services group like SECOM, which operates across security, fire protection, medical, insurance, geospatial information and BPO or ICT activities, this measure often reflects expectations around the durability and quality of those earnings streams rather than rapid expansion.
Earnings are forecast to grow 6.8% per year, which sits below the JP market forecast of 9.6% and below the 20% threshold that might justify a much richer multiple purely on growth expectations. In that context, a 23.9x P/E indicates that the market is assigning a premium mainly for earnings quality and business resilience rather than for acceleration in profits.
Comparing SECOM with its direct Commercial Services peers makes that premium very clear. The stock trades on a P/E of 23.9x against a JP Commercial Services industry average of 13.6x and a peer group average of 16.8x. It is also described as expensive relative to an estimated fair P/E of 23.8x, which barely differs from the current level and suggests limited room for the valuation multiple to expand from here without fresh information.
Explore the SWS fair ratio for SECOM.
Result: Price-to-earnings of 23.9x (OVERVALUED).
Still, any slip in SECOM's earnings growth against market forecasts, or a reset in analyst price targets, could quickly challenge the current valuation premium.
Find out about the key risks to this SECOM narrative.
Another View on SECOM's Value
The P/E discussion paints SECOM as expensive, yet the SWS DCF model points to a different conclusion. On that cash flow view, the shares trade about 8.2% below an estimated value of ¥7,260.98, with the current price at ¥6,662. That gap hints at a modest cushion. How much weight do you put on cash flow models when the earnings multiple looks stretched?
Look into how the SWS DCF model arrives at its fair value.
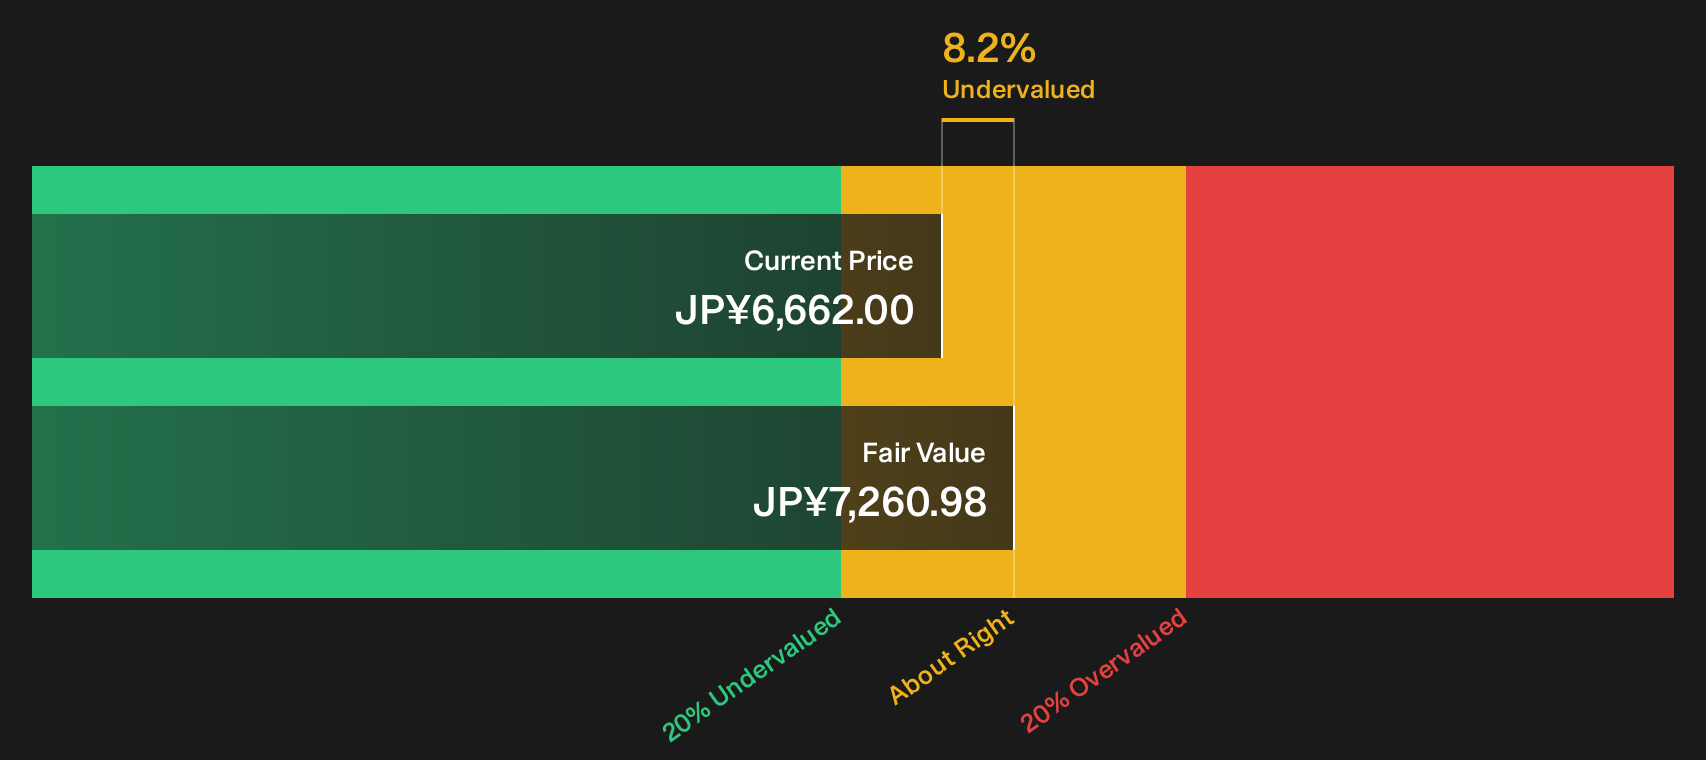
Simply Wall St performs a discounted cash flow (DCF) on every stock in the world every day (check out SECOM for example). We show the entire calculation in full. You can track the result in your watchlist or portfolio and be alerted when this changes, or use our stock screener to discover 16 high quality undervalued stocks. If you save a screener we even alert you when new companies match - so you never miss a potential opportunity.
Next Steps
Seen enough optimism around SECOM to form a view, or still on the fence about the valuation and buyback story as it stands today? Act while the data is fresh and shape your own thesis by weighing the 4 key rewards.
Looking for more investment ideas beyond SECOM?
If SECOM has sharpened your focus on valuation and quality, do not stop there. Apply the same filter to a broader watchlist and see what else stacks up.
- Explore potential mispricings by scanning a curated 16 high quality undervalued stocks that highlights companies with strong fundamentals at relatively appealing valuations.
- Identify income candidates by reviewing a focused 31 dividend fortresses that spotlights higher yielding businesses with the potential for more predictable cash returns.
- Prioritise resilience by checking a targeted 22 resilient stocks with low risk scores that filters for businesses with sturdier balance sheets and lower overall risk scores.
This article by Simply Wall St is general in nature. We provide commentary based on historical data and analyst forecasts only using an unbiased methodology and our articles are not intended to be financial advice. It does not constitute a recommendation to buy or sell any stock, and does not take account of your objectives, or your financial situation. We aim to bring you long-term focused analysis driven by fundamental data. Note that our analysis may not factor in the latest price-sensitive company announcements or qualitative material. Simply Wall St has no position in any stocks mentioned.
Have feedback on this article? Concerned about the content? Get in touch with us directly. Alternatively, email editorial-team@simplywallst.com