
- PRICING
- LIVE QUOTES
- LEARN
- HELP


EN
What Impinj (PI)'s Improved Quarterly Results Mean For Shareholders
- Impinj recently reported quarterly results that included higher revenue and an improved net profit position compared with the same period a year earlier.
- The company’s fundamentals, supported by RAIN RFID demand trends, have aligned with continued favorable analyst commentary on its long term prospects.
- Next, the focus shifts to what this revenue and net profit profile might mean for Impinj's broader investment narrative.
Scan beyond Impinj and consider other hardware driven connectivity plays that analysts are watching through a curated list of 92 AI infrastructure stocks in the same broad theme.
Impinj Investment Narrative Recap
To own Impinj, you need to be comfortable with a simple idea. RAIN RFID adoption has to keep broadening so the platform can turn its strong position in endpoint ICs and systems into durable profitability. The latest quarter, with higher revenue and a better net profit position than a year ago, supports that direction but does not remove the execution bar.
In the short term, the key swing factor is still how smoothly Impinj manages demand from large logistics and retail programs, especially after past Q1 order volatility. The main risk is that pricing, input costs or channel misreads undermine expectations for margin progress, given the current valuation already reflects a significant degree of success.
The most relevant update today is the recent quarterly report showing revenue growth with an improved net profit result versus the prior year period. That matters for the Impinj story because it directly tests whether expanding RAIN RFID deployments, including M800 driven efficiencies, are showing up in the income statement rather than remaining only as a slide in a presentation.
Improved profitability also interacts with the catalysts analysts focus on, such as broader use of RFID in food traceability and logistics and a richer mix of higher margin systems. A cleaner earnings profile can help management continue funding R&D and partner go to market efforts, while any slip back into larger losses would quickly refocus attention on valuation risk and execution discipline.
Impinj's narrative projects US$659.4 million revenue and US$85.9 million earnings by 2029. This rests on analysts modeling 21.1% yearly revenue growth and earnings moving from a loss of US$27.0 million today to a profit of US$85.9 million, an earnings swing of about US$112.9 million.
Uncover why Impinj's fair value indicates a 6% potential downside to its current price, a premium that may not hold if expectations slip.
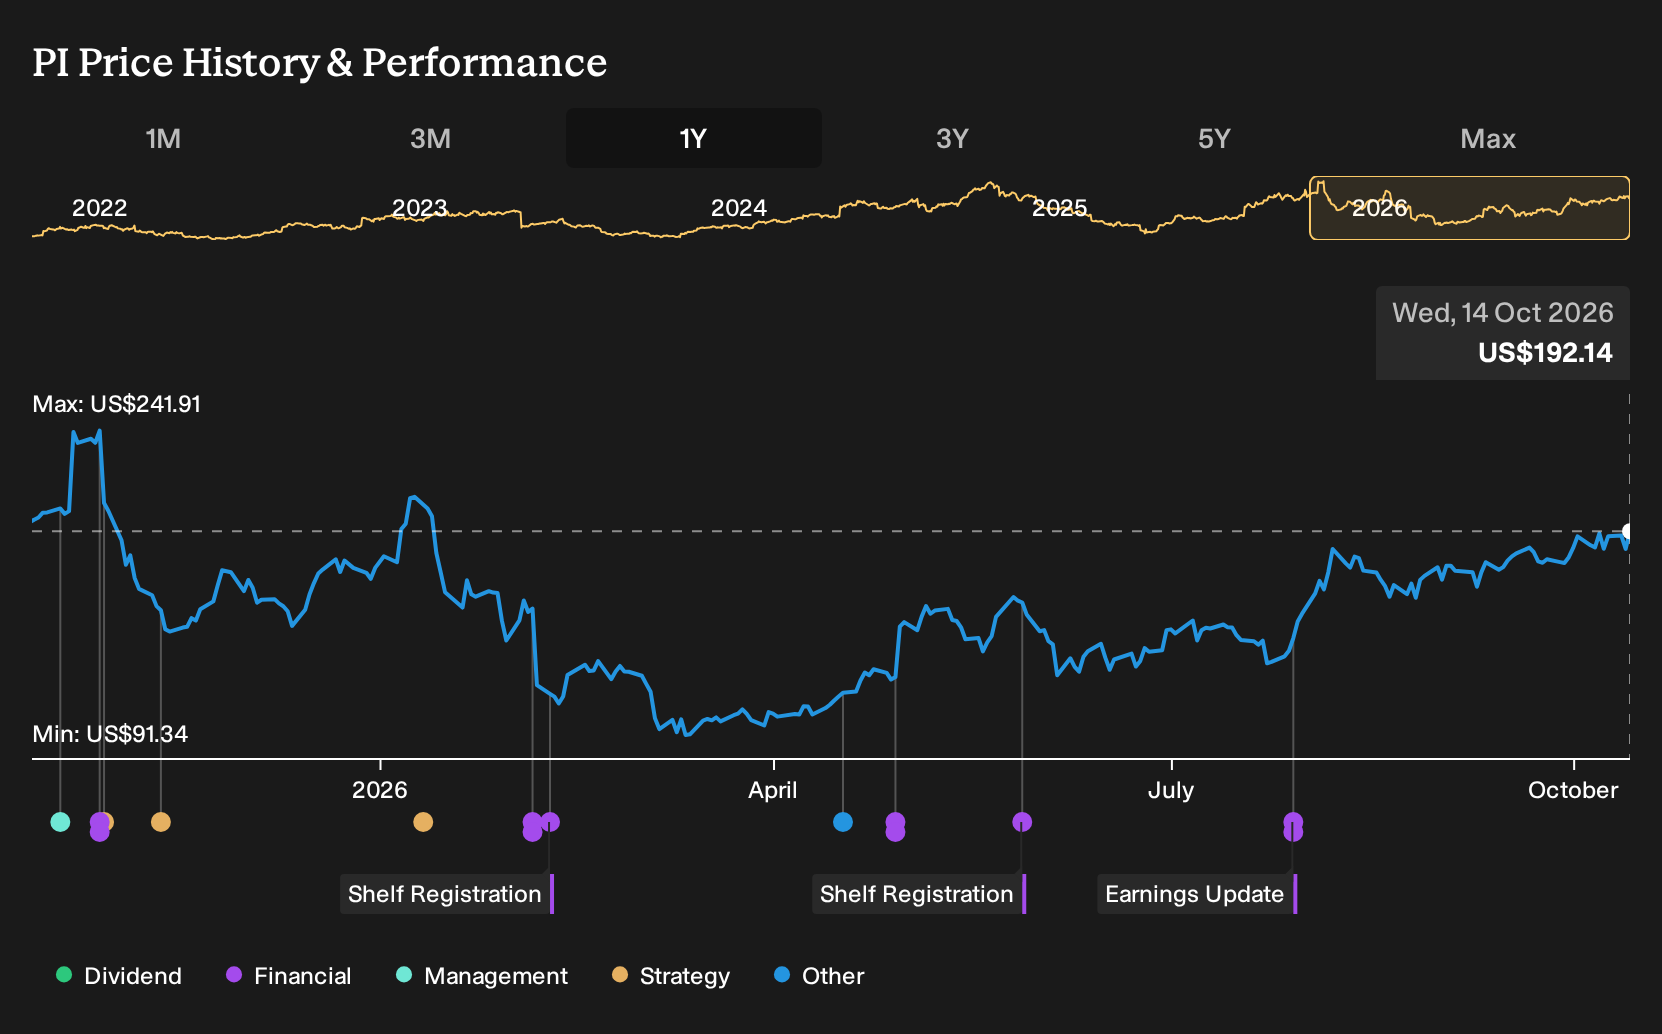
Exploring Other Perspectives
One alternate view on Impinj leans heavily on valuation risk. Those more cautious analysts were modeling about US$605.1 million of revenue and US$59.5 million of earnings by 2029, with a P/E near 107x. That is a far more pessimistic narrative than today’s bullish calls, and fresh results could nudge either camp to rethink its position.
Explore 2 other Impinj fair value estimates, including one that suggests as much as 99% downside from the current price.
Form Your Own Verdict
Disagree with existing narratives? Extraordinary investment returns rarely come from following the herd, so consider going with your own instincts.
- A great starting point for your Impinj research is our analysis highlighting 1 key reward that could impact your investment decision.
- See our latest analysis for Impinj. The report includes a comprehensive fundamental analysis summarized in a single visual, the Snowflake, making it easy to evaluate Impinj's overall financial health at a glance.
Looking For More Ideas Beyond Impinj?
Once you have a view on Impinj, it can help to widen the lens and compare it with other opportunities that fit different risk and return profiles. The Simply Wall St Screener groups stocks by traits that matter to you, so you can build a watchlist that matches your own approach rather than relying only on consensus views.
- If capital preservation sits near the top of your priority list, start with 32 resilient stocks with low risk scores that score well on stability and resilience.
- For investors hunting for quality at a reasonable price, scan through a 32 high quality undervalued stocks that combine solid fundamentals with more modest expectations baked into the share price.
- Those who care most about balance sheet strength can focus on a list of solid balance sheet and fundamentals (25 results) to find businesses that carry less financial strain.
This article by Simply Wall St is general in nature. We provide commentary based on historical data and analyst forecasts only using an unbiased methodology and our articles are not intended to be financial advice. It does not constitute a recommendation to buy or sell any stock, and does not take account of your objectives, or your financial situation. We aim to bring you long-term focused analysis driven by fundamental data. Note that our analysis may not factor in the latest price-sensitive company announcements or qualitative material. Simply Wall St has no position in any stocks mentioned.
Have feedback on this article? Concerned about the content? Get in touch with us directly. Alternatively, email editorial-team@simplywallst.com