
- PRICING
- LIVE QUOTES
- LEARN
- HELP


EN
Dycom Industries (DY) Fiber Buildout Story Puts Valuation Back In Focus
Dycom Industries (DY) has been drawing attention after recent price weakness. The stock closed at US$259.96, with declines over the past week, month, and past 3 months now in clear focus for investors.
Recent declines have arrived after a strong multi year stretch, with Dycom Industries delivering a 3 year total shareholder return of about 220% and around 240% over 5 years. Short term share price momentum has clearly faded in recent months as investors reassess risk and potential growth expectations around US$259.96 per share.
Scan how Dycom Industries stacks up against other contractors facing similar sentiment resets by reviewing the hand picked 43 power grid technology and infrastructure stocks in this corner of the market.
That sharp pullback now sits against years of strong returns and a current price of about US$259.96. Does that mix tilt the risk reward in favor of new Dycom Industries buyers, or does it suggest more caution on valuation?
Most Popular Narrative: 50% Undervalued
Against a last close of about $259.96, the most followed narrative puts Dycom Industries' fair value near $520.91. This frames the recent pullback as a sizable gap between price and what long term cash generation may support.
The accelerating buildout of fiber-to-the-home and data center connectivity, supported by Dycom Industries reporting nearly 60% first half fiber-to-the-home revenue growth and record quarterly revenue of US$2.01b, is translating into a larger, longer duration work slate that is already embedded in the roughly US$12.2b backlog. This can continue to support contract revenue and EBITDA growth. Substantial public and customer investment tailwinds, including Dycom Industries beginning to recognize BEAD related field engineering revenue in the Northeast and management framing BEAD as an incremental multi year construction opportunity from fiscal 2028, are expanding the pool of yet to be executed projects that can add to future contract revenues and segment margins.
See why 24 investors see Dycom Industries as 50% undervalued.
Result: Fair Value of $520.91 (UNDERVALUED)
Still, the Dycom Industries story can change quickly if major telecom or data center clients slow project awards, or if tight labor markets squeeze fixed contract margins.
Find out about the key risks to this Dycom Industries narrative.
Another View: What Multiples Say About Dycom Industries
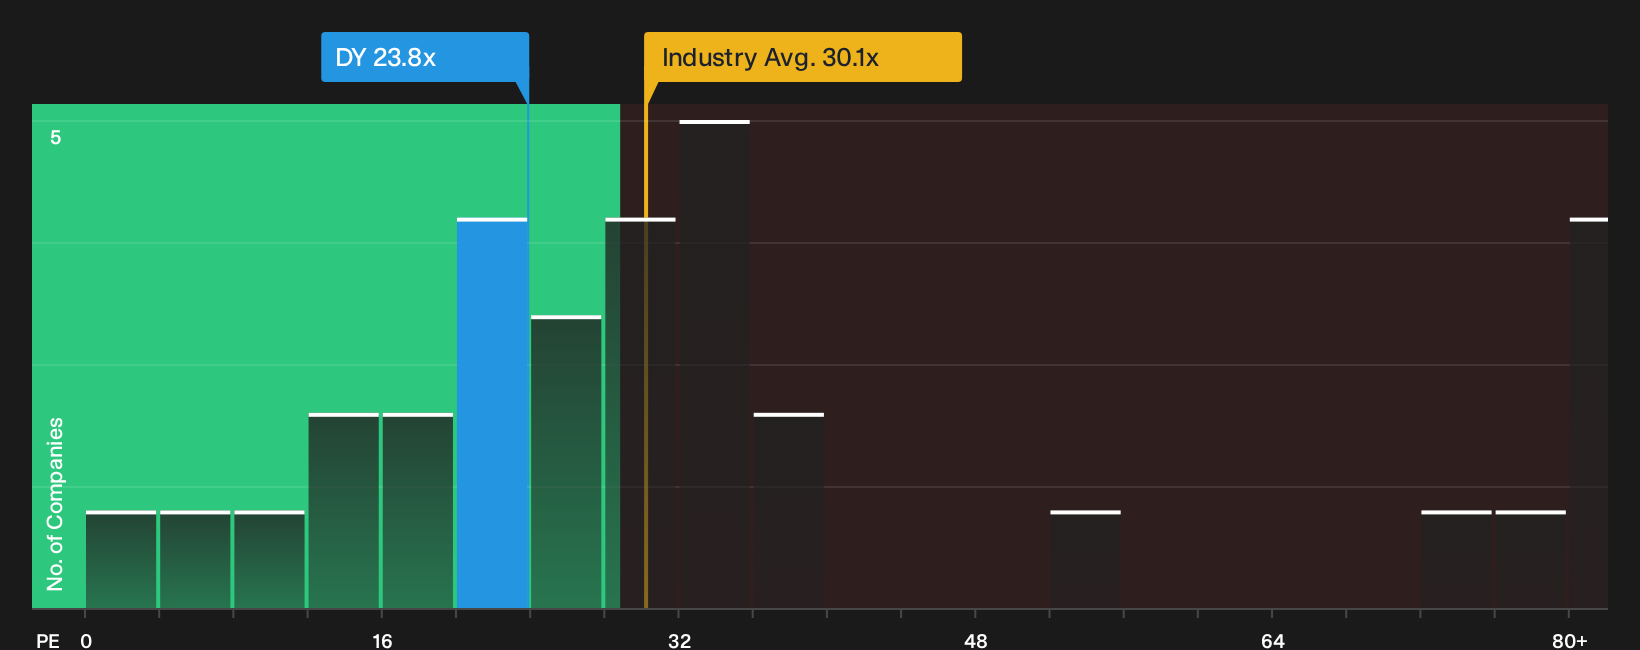
Step away from cash flow models and the picture softens. Dycom Industries trades on a P/E of 23.8x, slightly above the 23.5x peer average but below both the US Construction group at 30.1x and a fair ratio of 32.8x. Is that a cushion or a warning that expectations already run hot?
For a closer look at how the current P/E compares with what the fair ratio suggests the market could move toward over time, See what the numbers say about this price — find out in our valuation breakdown.
Next Steps
Mixed messages on Dycom Industries so far? Act quickly, review the full set of risks and potential upsides, and weigh the 4 key rewards and 1 important warning sign.
Looking for more investment ideas beyond Dycom Industries?
If Dycom Industries has your attention, do not stop here. Fresh ideas can sharpen your watchlist and keep your next move one step ahead.
- Spot potential value opportunities early by reviewing the 32 high quality undervalued stocks that combine quality fundamentals with prices that may not fully reflect them yet.
- Strengthen your downside protection by scanning the 32 resilient stocks with low risk scores that pair financial resilience with more measured volatility.
- Get ahead of the crowd by tracking the 20 high quality undiscovered gems before they appear on everyone else's radar.
This article by Simply Wall St is general in nature. We provide commentary based on historical data and analyst forecasts only using an unbiased methodology and our articles are not intended to be financial advice. It does not constitute a recommendation to buy or sell any stock, and does not take account of your objectives, or your financial situation. We aim to bring you long-term focused analysis driven by fundamental data. Note that our analysis may not factor in the latest price-sensitive company announcements or qualitative material. Simply Wall St has no position in any stocks mentioned.
Have feedback on this article? Concerned about the content? Get in touch with us directly. Alternatively, email editorial-team@simplywallst.com