
- PRICING
- LIVE QUOTES
- LEARN
- HELP


EN
Is Barclays Upgrade Altering The Investment Case For NatWest Stock (LSE:NWG)?
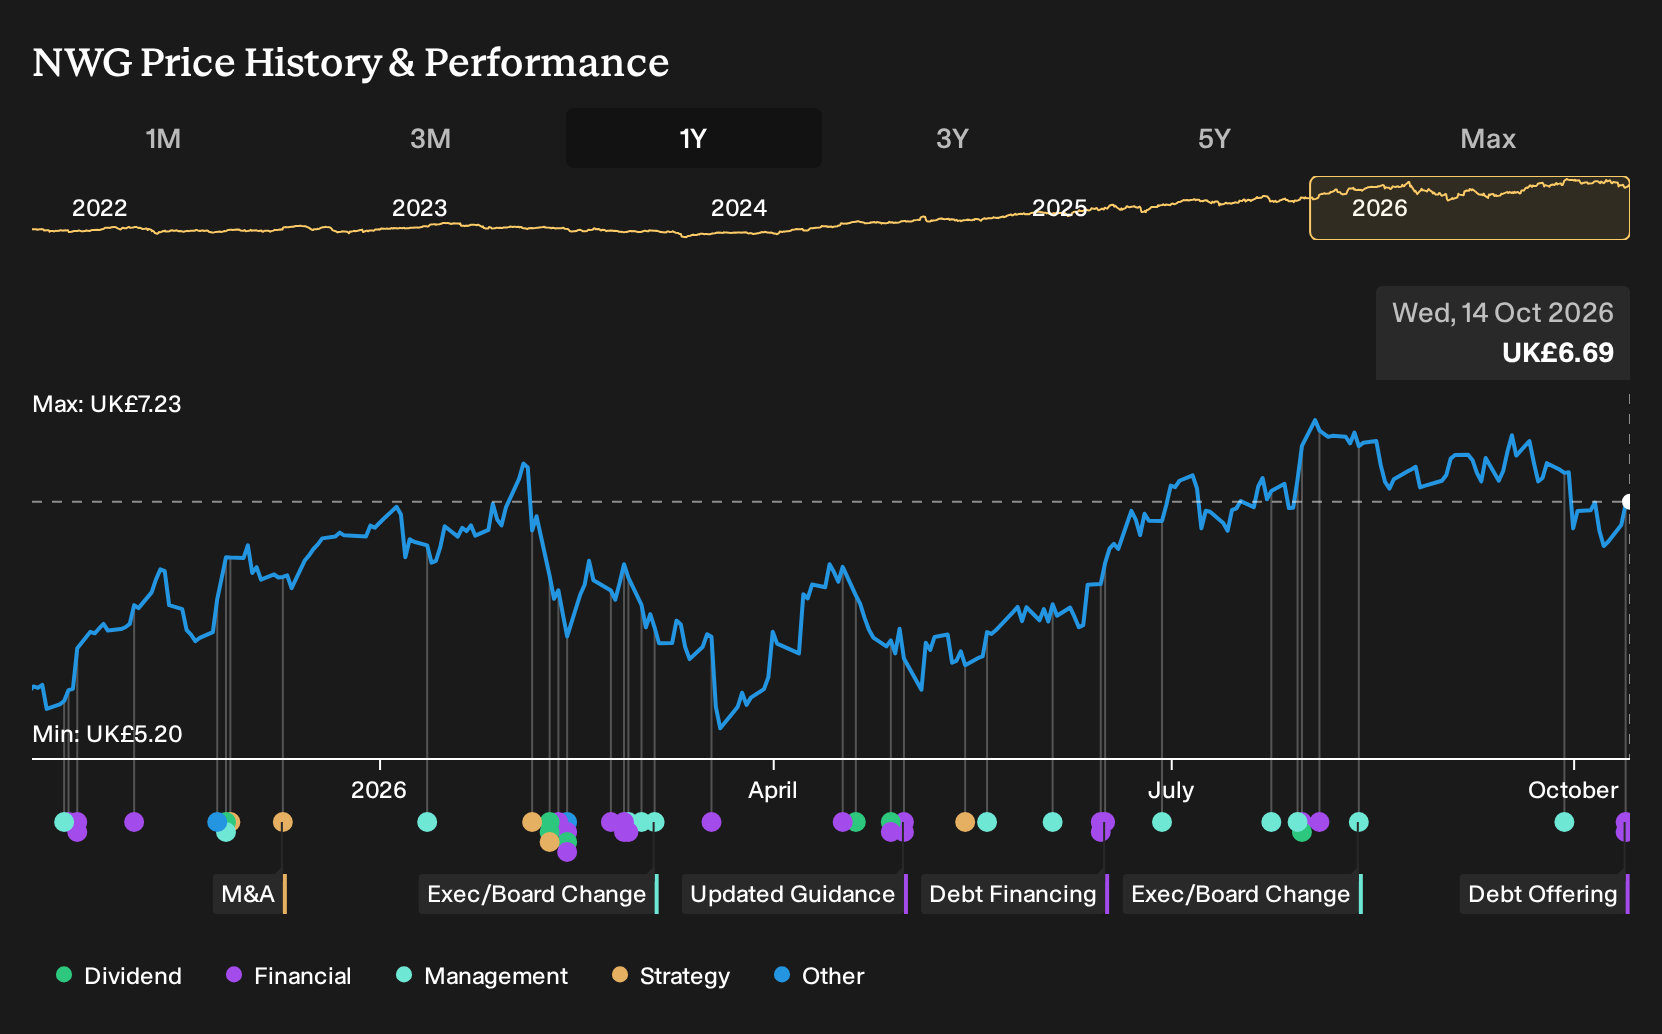
- NatWest Group recently completed a US$1b fixed to floating rate senior unsecured note offering due October 16, 2032, with callable and variable coupon features that broaden its funding mix beyond deposits.
- The new variable rate Eurobond style funding adds flexibility for NatWest Group to support lending and wealth activities alongside the Evelyn integration without relying solely on covered or retail funding.
- This article examines how NatWest Group's investment narrative intersects with this new US$1b variable rate funding initiative.
Scan beyond NatWest Group into other banks that are adjusting their funding mix with variable and fixed income instruments by reviewing our curated list of solid balance sheet and fundamentals (9 results).
NatWest Group Investment Narrative Recap
To own NatWest Group, you need to be comfortable with a UK focused lender that is leaning into capital light fee income, efficiency gains from AI and moderate lending expansion rather than chasing rapid balance sheet growth. The key near term swing factor is how net interest margin holds up as lower margin mortgages and Commercial and Institutional loans expand, while lending spreads on mortgages move from about 70 bps to around 60 bps.
The fresh US$1b fixed to floating note funding does not radically change that picture. It slightly eases pressure from loan growth running ahead of deposits, yet it also edges NatWest Group further toward wholesale funding dependence, which could weigh on margins if pricing tightens less than hoped and if deposits do not catch up.
The most relevant recent development alongside this bond issue is the completion of the Evelyn Partners acquisition, which more than doubled assets under management and administration to £131b and is expected to lift group fee income by about 20%. For you as a shareholder, the key question is whether wealth and payments fees, together with AI driven cost savings, can offset a flatter lending margin profile.
Viewed next to that, the US$1b variable rate notes look like plumbing that supports the broader shift. The bank is growing Commercial and Institutional lending into infrastructure, social housing, renewables, utilities and funds lending, which targets lower risk weighted assets and volume based interest income. This mix, combined with AI enabled efficiency and a larger wealth platform, forms the core operational catalyst and also the main execution test for NatWest Group over the next few years.
What The New Funding Move Means For The NatWest Group Numbers
NatWest Group's funding tweak only really comes into focus when it is lined up against what analysts already bake into their models for revenue, profit and valuation. The fresh US$1b fixed to floating notes are small compared with the forecast earnings and capital generation story that sits behind current research targets, yet they still shape the mix of interest costs and balance sheet flexibility that those forecasts assume.
Analysts currently factor in revenue growth of 7.2% a year over the next few years and expect net profit margins to ease from 35.9% today to 33.4% by around 2029. Against that backdrop, a US$1b slice of senior wholesale funding looks more like a tool to keep lending and wealth plans moving without pushing the loan to deposit ratio uncomfortably high, rather than a swing factor for the whole earnings profile.
The bigger anchor for expectations is the earnings path. Consensus points to profit of £6.9b by about 2029, up from £6.0b today, which implies an increase of roughly £0.9b. In that context, the cost of the new fixed to floating notes, alongside other wholesale issuance, feeds into how much of that extra £0.9b actually drops through to shareholders after funding costs and tax.
Forecasts also assume that NatWest Group trades on a higher P/E in a few years. The current multiple of 8.4x would, on consensus numbers, need to move to 11.5x on the £6.9b earnings estimate for 2029. The market already prices in a discount to the 11.5x assumption, so any shift in funding structure that investors read as higher risk or lower quality could make it harder for the stock to move closer to that implied level.
Analysts then tie those operational and valuation inputs together into a fair value framework. A central price target of £7.98 sits above a current share price around £6.40, framed by a range from £6.50 on the cautious end to £8.80 on the more optimistic side. That spread reflects different views on how smoothly NatWest Group can integrate Evelyn Partners, manage wholesale funding, and hold margins while keeping a lid on costs.
Behind the share price work sits a revenue estimate of £20.7b and the same £6.9b earnings forecast for 2029, discounted back using a cost of equity assumption around 8.5%. The model does not live or die on one bond issue. Even so, the decision to add US$1b of fixed to floating notes fits with an outlook where loan growth, fee expansion and capital returns are all expected to be funded without stretching the retail deposit base alone.
Analysts also expect the share count to shrink by about 0.9% a year over the next 3 years. If buybacks progress at that pace and earnings reach the £6.9b level that current models suggest, the combination of higher profit and fewer shares could support earnings per share, provided wholesale funding costs, including the new variable rate notes, do not erode too much of the operating gain.
NatWest Group's narrative projects £20.7b revenue and £6.9b earnings by 2029. This rests on 7.2% yearly revenue growth and an earnings increase of about £0.9b from £6.0b today.
Discover why NatWest Group's fair value points to a 19% potential upside from its current price, which could materialize more quickly than many investors anticipate.
Exploring Other Perspectives
Three fair value estimates from the Simply Wall St Community span roughly £7.98 to £13.53, so some retail investors see NatWest Group close to current targets while others price in far richer outcomes. Set that against risks around net interest margin pressure and heavier wholesale funding, and you can see why opinions diverge. Use this spread to test several alternative viewpoints before you commit fresh capital.
Explore 2 other NatWest Group fair value estimates, including one that suggests as much as 102% upside from the current price!
Decide For Yourself
Disagree with existing narratives? Extraordinary investment returns rarely come from following the herd, so go with your instincts.
- A great starting point for your NatWest Group research is our analysis highlighting 5 key rewards and 3 important warning signs that could impact your investment decision.
- See our latest analysis for NatWest Group. The report includes a comprehensive fundamental analysis summarized in a single visual, the Snowflake, making it easy to evaluate NatWest Group's overall financial health at a glance.
Looking For More Investment Ideas Beyond NatWest Group?
Once you have a view on NatWest Group, it often helps to widen the lens and compare it with other listed businesses that match your risk appetite, income needs and return goals. The Simply Wall St Screener can help you quickly filter the market into focused shortlists that fit the type of portfolio you want to build next.
- For investors who want potential mispricing combined with quality fundamentals, consider reviewing a curated 8 high quality undervalued stocks that may help surface candidates for further research.
- If capital preservation and steadier profiles matter more to you than chasing every upswing, scan our 4 resilient stocks with low risk scores to see which companies align with that mindset.
- When you want to broaden your watchlist with less crowded opportunities, use the 5 high quality undiscovered gems to highlight stocks that still fly under most investors' radar.
This article by Simply Wall St is general in nature. We provide commentary based on historical data and analyst forecasts only using an unbiased methodology and our articles are not intended to be financial advice. It does not constitute a recommendation to buy or sell any stock, and does not take account of your objectives, or your financial situation. We aim to bring you long-term focused analysis driven by fundamental data. Note that our analysis may not factor in the latest price-sensitive company announcements or qualitative material. Simply Wall St has no position in any stocks mentioned.
Have feedback on this article? Concerned about the content? Get in touch with us directly. Alternatively, email editorial-team@simplywallst.com