
- PRICING
- LIVE QUOTES
- LEARN
- HELP


EN
Does Strong September Sales Change The Bull Case For Don Quijote Operator Pan Pacific International Holdings (TSE:7532)?
- Pan Pacific International Holdings reported September 2026 domestic comparable store sales at 103.1% year over year, with all domestic retail outlets reaching 105.2%, supported by discount store all-store sales of 106.3% and UNY all-store sales of 101.7%.
- The broad-based strength across both discount and UNY formats suggests Pan Pacific International Holdings is attracting steady consumer traffic across its core Japanese retail footprint, rather than relying on a single banner or region.
- Next, the focus shifts to how this broad-based lift in comparable sales reshapes Pan Pacific International Holdings' investment narrative and operating outlook.
What Is Pan Pacific International Holdings' Investment Narrative?
To own Pan Pacific International Holdings, you need to be comfortable with a fairly simple idea. This is a high volume retailer that lives or dies on traffic, tight execution in stores and disciplined cost control. The September comp sales print in Japan above 100% hints that shoppers are still coming through the doors and that pricing and assortment are holding up. That helps in the near term, because the big swing factors right now are day to day demand, ticket size and how well management keeps operating expenses in check across discount and UNY formats.
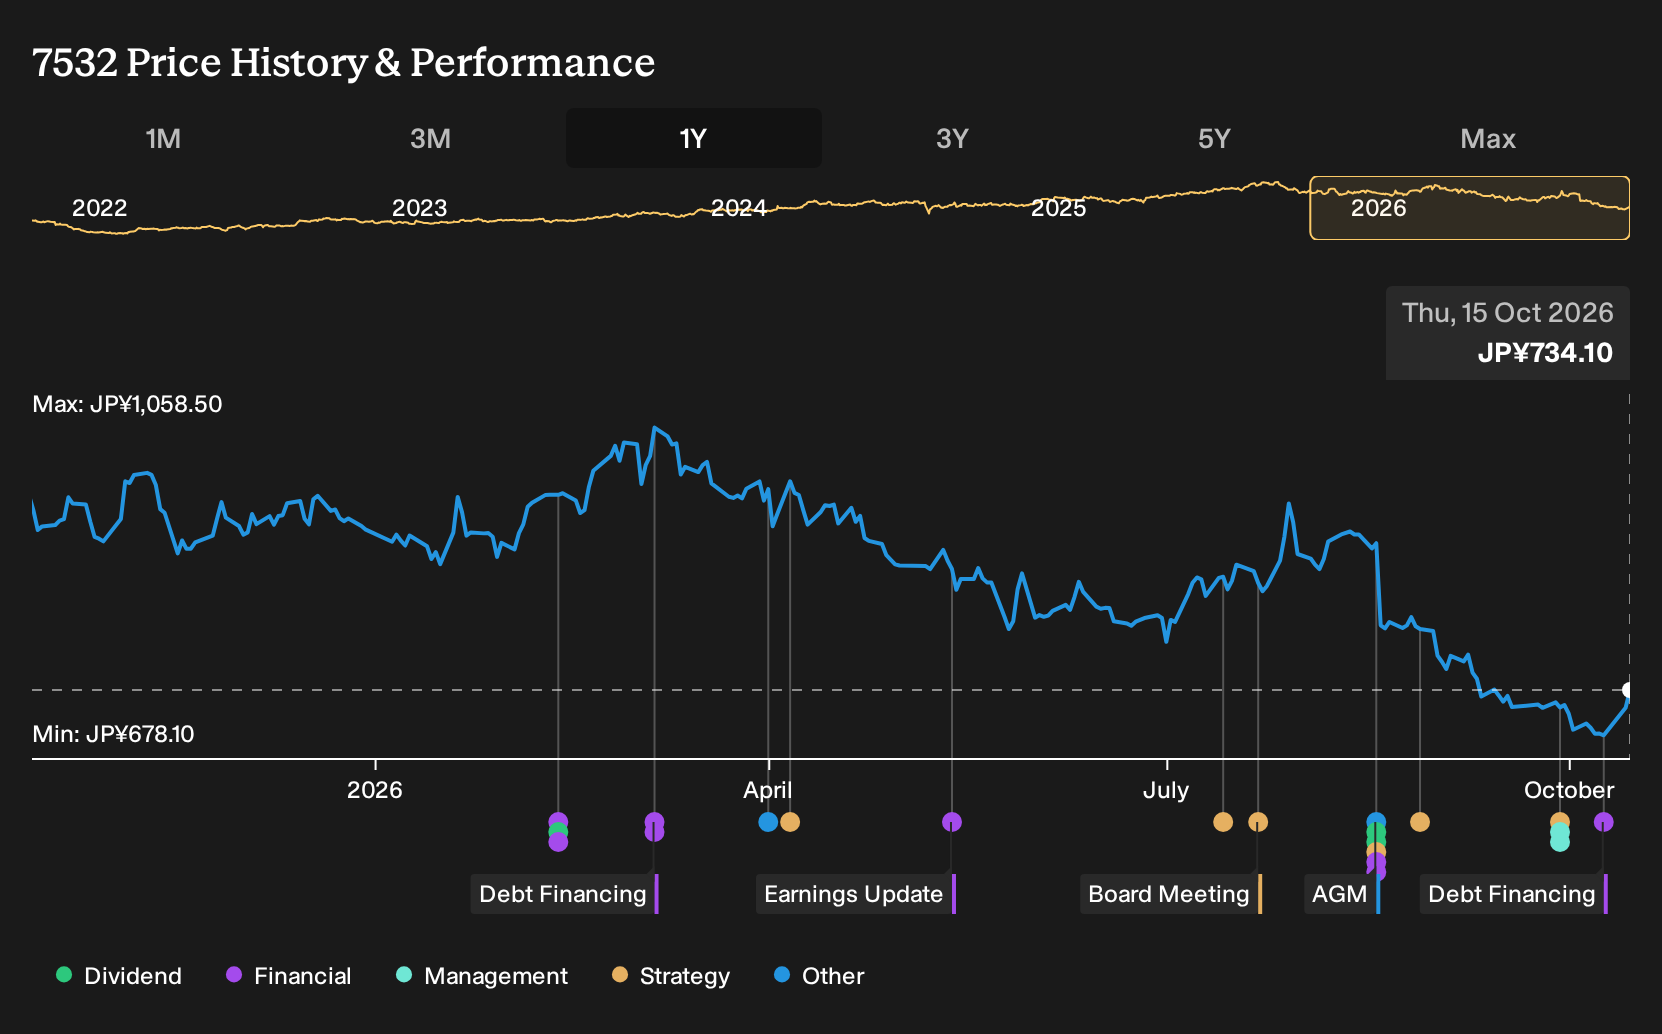
The fresh JPY 25b bond issue on a 3 year maturity also indicates the group is leaning on external funding to manage its capital needs. Proceeds go to refinancing, so this is housekeeping rather than a growth splash, but it still keeps leverage and funding costs in the conversation. At the same time, this is a retailer with growing earnings, a seasoned leadership team and a stock that has fallen about 20% over the past year even as analysts see upside from here. That mix only makes sense if investors are clear eyed about the biggest vulnerability in the story.
Yet there is a less comfortable angle that starts to matter if conditions turn even slightly against this model, and it is...
There's only one way to know the right time to buy, sell or hold Pan Pacific International Holdings. Head to Simply Wall St's company report for the latest analysis of Pan Pacific International Holdings's Fair Value.
Decide For Yourself
Don't just follow the ticker. Dig into the data and build a conviction that's truly your own.
- A great starting point for your Pan Pacific International Holdings research is our analysis highlighting 3 key rewards that could impact your investment decision.
- See our latest analysis for Pan Pacific International Holdings. The report includes a comprehensive fundamental analysis summarized in a single visual, the Snowflake, making it easy to evaluate Pan Pacific International Holdings' overall financial health at a glance.
Looking For More Ideas Beyond Pan Pacific International Holdings?
If you want to balance your view on Pan Pacific International Holdings with other possibilities, a quick scan of different types of stocks can sharpen your watchlist and help you stress test your thesis.
- For investors hunting for smaller companies with room to prove themselves, consider reviewing 1 elite penny stocks with strong financials that pass tighter financial filters before you add anything to your shortlist.
- If value is your anchor and you prefer companies with strong cash generation relative to what you pay, take a look at our 15 high quality undervalued stocks to see which businesses currently screen as potentially mispriced.
- For a more defensive tilt that still keeps quality in focus, you can filter for balance sheets that look sturdier than most by running the list of solid balance sheet and fundamentals (21 results) and comparing those results to your existing holdings.
This article by Simply Wall St is general in nature. We provide commentary based on historical data and analyst forecasts only using an unbiased methodology and our articles are not intended to be financial advice. It does not constitute a recommendation to buy or sell any stock, and does not take account of your objectives, or your financial situation. We aim to bring you long-term focused analysis driven by fundamental data. Note that our analysis may not factor in the latest price-sensitive company announcements or qualitative material. Simply Wall St has no position in any stocks mentioned.
Have feedback on this article? Concerned about the content? Get in touch with us directly. Alternatively, email editorial-team@simplywallst.com