
- PRICING
- LIVE QUOTES
- LEARN
- HELP


EN
Undiscovered Gems Three Promising UK Stocks In October 2026
The UK market has recently faced challenges, with the FTSE 100 index slipping due to weak trade data from China and a dip in commodity prices impacting major sectors. Amidst these broader economic pressures, identifying promising stocks requires a focus on companies that demonstrate resilience and potential for growth despite global uncertainties.
Top 5 Undiscovered Gems With Strong Fundamentals In The United Kingdom
| Name | Debt To Equity | Revenue Growth | Earnings Growth | Health Rating |
|---|---|---|---|---|
| Serabi Gold | NA | 26.04% | 57.00% | ★★★★★★ |
| Yü Group | 12.20% | 31.64% | 40.36% | ★★★★★☆ |
| Integrated Diagnostics Holdings | 7.96% | 15.27% | 4.96% | ★★★★★☆ |
| LSL Property Services | 40.81% | -14.51% | -16.53% | ★★★★★☆ |
| CAB Payments Holdings | NA | 6.45% | -17.86% | ★★★★★☆ |
| Distribution Finance Capital Holdings | 15.26% | 36.03% | 48.64% | ★★★★☆☆ |
| ASA International Group | 227.04% | 17.96% | 44.59% | ★★★☆☆☆ |
We'll examine a selection from our screener results.
Yü Group (AIM:YU.)
Simply Wall St Value Rating: ★★★★★☆
Overview: Yü Group PLC, with a market cap of £287.60 million, operates through its subsidiaries to supply energy and utility solutions mainly in the United Kingdom.
Operations: Yü Group PLC generates revenue through the supply of energy and utility solutions in the UK. The company's net profit margin is 3.5%, reflecting its ability to convert sales into actual profit after all expenses are accounted for.
Yü Group, a dynamic player in the UK market, showcases intriguing financials with its shares trading at 56.4% below estimated fair value. Despite a slight dip in net income to £15.9 million for the first half of 2026 from £16.6 million last year, it remains profitable with strong interest coverage and positive free cash flow of £61.94 million as of September 2024. The debt-to-equity ratio has risen to 12.2% over five years, yet the company holds more cash than total debt, indicating sound financial health amidst board changes and dividend increases to 24 pence per share this period.
- Delve into the full analysis health report here for a deeper understanding of Yü Group.
Gain insights into Yü Group's past trends and performance with our Past report.
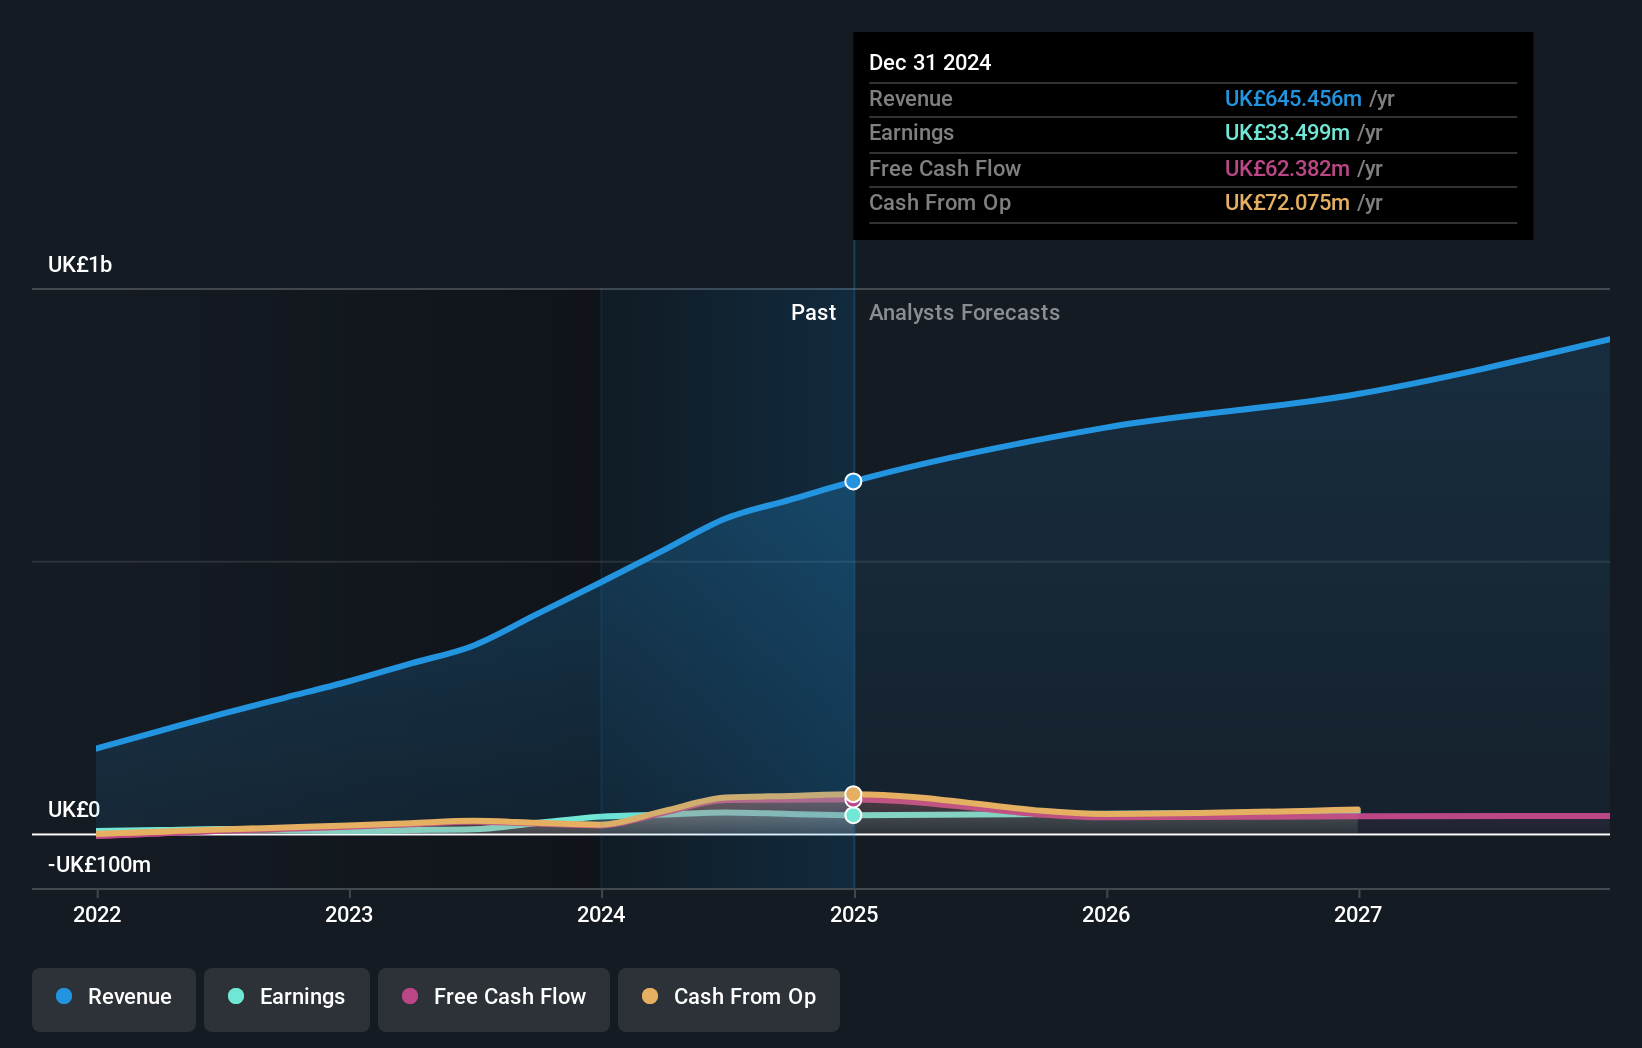
CAB Payments Holdings (LSE:CABP)
Simply Wall St Value Rating: ★★★★★☆
Overview: CAB Payments Holdings plc operates in the business-to-business cross-border payments and foreign exchange services sector across various regions including the Americas, Europe, Africa, the Middle East, and Asia with a market cap of approximately £208.17 million.
Operations: CAB Payments Holdings generates revenue primarily from its business-to-business cross-border payments and foreign exchange services, with reported revenues of £84.43 million. The company has a market capitalization of approximately £208.17 million.
CAB Payments Holdings, a dynamic player in the UK financial landscape, has shown impressive earnings growth of 230.5% over the past year, outpacing its industry peers significantly. Trading at 25.5% below estimated fair value, it offers an attractive proposition for investors seeking undervalued opportunities. The company is debt-free now compared to five years ago when its debt-to-equity ratio was 0.5%, highlighting prudent financial management. Despite recent index exclusion and insider selling activity, CAB Payments remains focused on strategic acquisitions to drive future growth while maintaining high-quality earnings and profitability without concerns over cash runway or interest coverage due to its strong position.
- Unlock comprehensive insights into our analysis of CAB Payments Holdings stock in this health report.
Evaluate CAB Payments Holdings' historical performance by accessing our past performance report.

LSL Property Services (LSE:LSL)
Simply Wall St Value Rating: ★★★★★☆
Overview: LSL Property Services plc, with a market cap of £251.71 million, operates as a business-to-business platform offering residential market services in the United Kingdom through its various subsidiaries.
Operations: LSL Property Services generates revenue primarily from its Surveying and Valuation segment at £110.70 million, followed by Financial Services at £48.19 million, and Estate Agency services at £26.70 million.
LSL Property Services, a notable player in the UK real estate sector, has shown promising financial resilience. The company reported half-year sales of £92.31 million, up from £89.67 million last year, with net income rising to £8.61 million from £8.19 million. Its basic earnings per share increased to 0.086 GBP compared to 0.08 GBP a year ago, while diluted earnings per share also saw an uptick to 0.085 GBP from 0.079 GBP previously noted for the same period last year.. Trading at approximately 44% below its estimated fair value suggests potential undervaluation opportunities for investors seeking growth prospects in this market segment.
- Click here to discover the nuances of LSL Property Services with our detailed analytical health report.
Assess LSL Property Services' past performance with our detailed historical performance reports.

Make It Happen
- Unlock more gems! Our UK Undiscovered Gems With Strong Fundamentals screener has unearthed 4 more companies for you to explore.Click here to unveil our expertly curated list of 7 UK Undiscovered Gems With Strong Fundamentals.
- Are you invested in these stocks already? Keep abreast of every twist and turn by setting up a portfolio with Simply Wall St, where we make it simple for investors like you to stay informed and proactive.
- Invest smarter with the free Simply Wall St app providing detailed insights into every stock market around the globe.
Interested In Other Possibilities?
- Explore high-performing small cap companies that haven't yet garnered significant analyst attention.
- Fuel your portfolio with companies showing strong growth potential, backed by optimistic outlooks both from analysts and management.
- Find companies with promising cash flow potential yet trading below their fair value.
This article by Simply Wall St is general in nature. We provide commentary based on historical data and analyst forecasts only using an unbiased methodology and our articles are not intended to be financial advice. It does not constitute a recommendation to buy or sell any stock, and does not take account of your objectives, or your financial situation. We aim to bring you long-term focused analysis driven by fundamental data. Note that our analysis may not factor in the latest price-sensitive company announcements or qualitative material. Simply Wall St has no position in any stocks mentioned.
Have feedback on this article? Concerned about the content? Get in touch with us directly. Alternatively, email editorial-team@simplywallst.com