
- PRICING
- LIVE QUOTES
- LEARN
- HELP


EN
Aramis Group SAS And 2 Other European Penny Stocks To Consider
European equities have experienced a volatile period, influenced by Middle East tensions, a hawkish European Central Bank stance, and mixed economic data from the eurozone. Amid these fluctuations, investors often look to penny stocks as potential opportunities for growth at lower price points. Although the term 'penny stock' may seem outdated, it remains relevant as these smaller or newer companies can offer significant upside when backed by strong financials and solid fundamentals.
Let's explore several standout options from the results in the screener.
Aramis Group SAS (ENXTPA:ARAMI)
Simply Wall St Financial Health Rating: ★★★★★★
Overview: Aramis Group SAS operates in the online sale of used vehicles across France, Belgium, the United Kingdom, Austria, Italy, and Spain with a market cap of €281.79 million.
Operations: The company's revenue is primarily derived from Refurbished Cars (€1.48 billion), followed by Pre-Registered Cars (€556.04 million), B2B (€141.32 million), and Services (€125.09 million).
Market Cap: €281.79M
Aramis Group SAS, with a market cap of €281.79 million, operates in the online sale of used vehicles and has shown mixed financial performance. Despite a satisfactory net debt to equity ratio of 19.3% and strong cash flow covering its debt, the company experienced negative earnings growth of -45.3% last year compared to the industry average decline of -3%. Recent revenue results showed a decrease for both the third quarter (€559.2 million) and nine months (€1.69 billion) ending June 2026 compared to previous periods, indicating challenges in maintaining revenue momentum amidst high share price volatility and lower profit margins (0.6%).
- Click here and access our complete financial health analysis report to understand the dynamics of Aramis Group SAS.
- Understand Aramis Group SAS' earnings outlook by examining our growth report.
JR Holding ASI (WSE:JRH)
Simply Wall St Financial Health Rating: ★★★★☆☆
Overview: JR Holding ASI S.A. is an investment company based in Poland with a market capitalization of PLN161.10 million.
Operations: The company generates revenue primarily from its investment activities, amounting to PLN39.05 million.
Market Cap: PLN161.1M
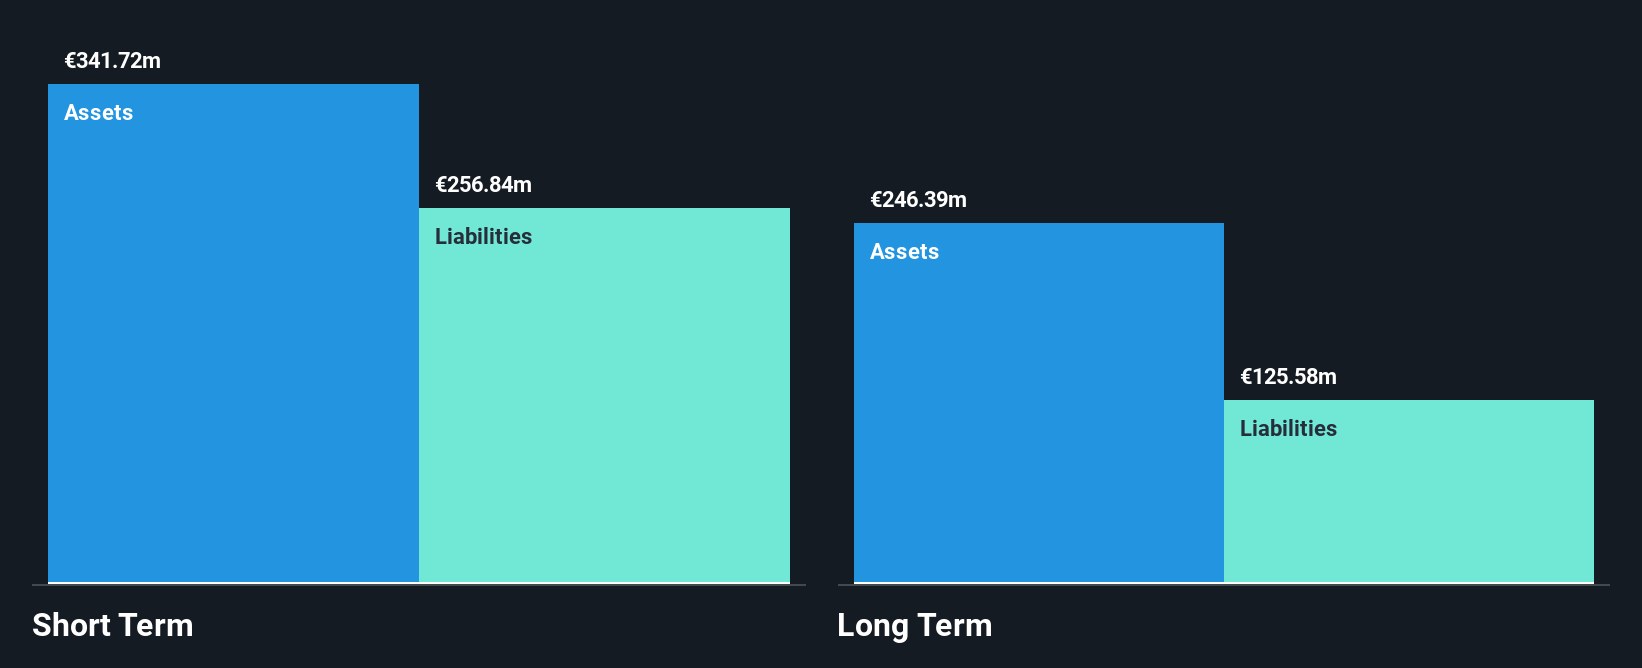
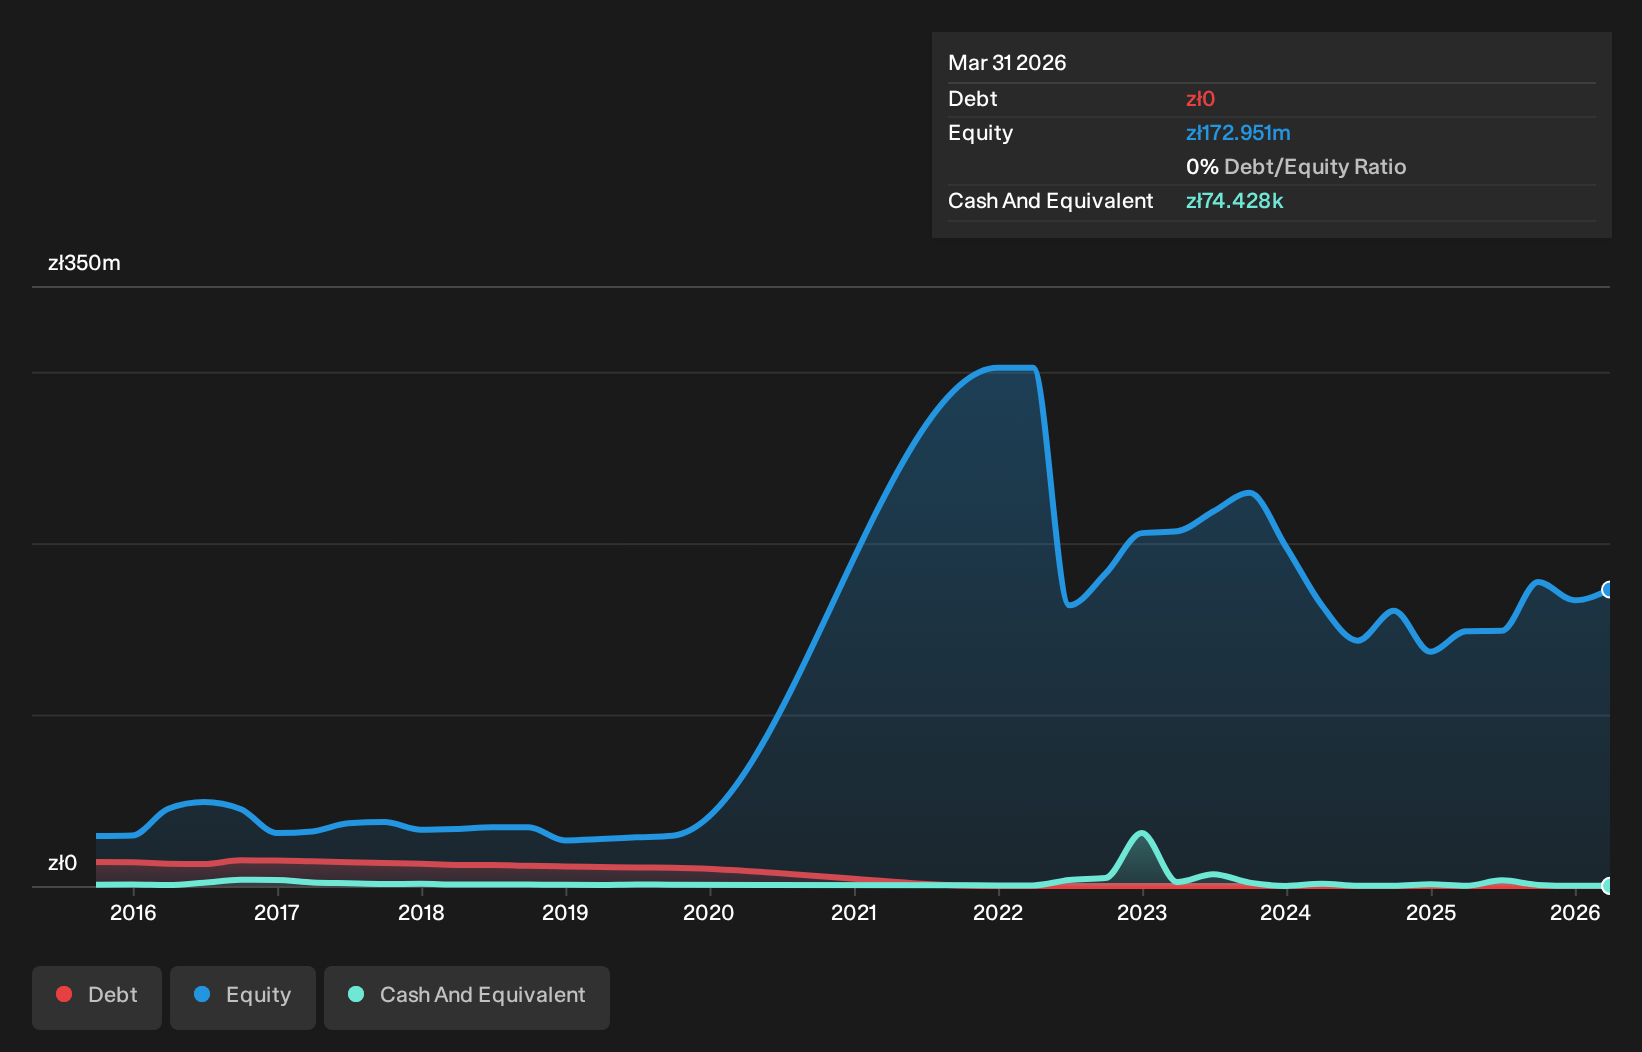
JR Holding ASI, with a market cap of PLN161.10 million, has demonstrated robust earnings growth over the past year at 368.4%, significantly outpacing its five-year average of 72.5% per year. The company is debt-free, which eliminates concerns about interest coverage and debt management. However, its short-term assets of PLN7.6 million fall short of covering both its short-term liabilities (PLN46.3 million) and long-term liabilities (PLN8.1 million). Recent earnings results showed a decline in revenue to PLN10.1 million for the half-year ended June 2026 from PLN19.66 million the previous year, impacting net income and EPS figures accordingly.
- Dive into the specifics of JR Holding ASI here with our thorough balance sheet health report.
- Assess JR Holding ASI's previous results with our detailed historical performance reports.
NAGA Group (XTRA:N4G0)
Simply Wall St Financial Health Rating: ★★★★☆☆
Overview: The NAGA Group AG develops and offers fintech products and services across Latin America, the Middle East, North Africa, and Southeast Asia with a market cap of €60.29 million.
Operations: The company has not reported any specific revenue segments.
Market Cap: €60.29M
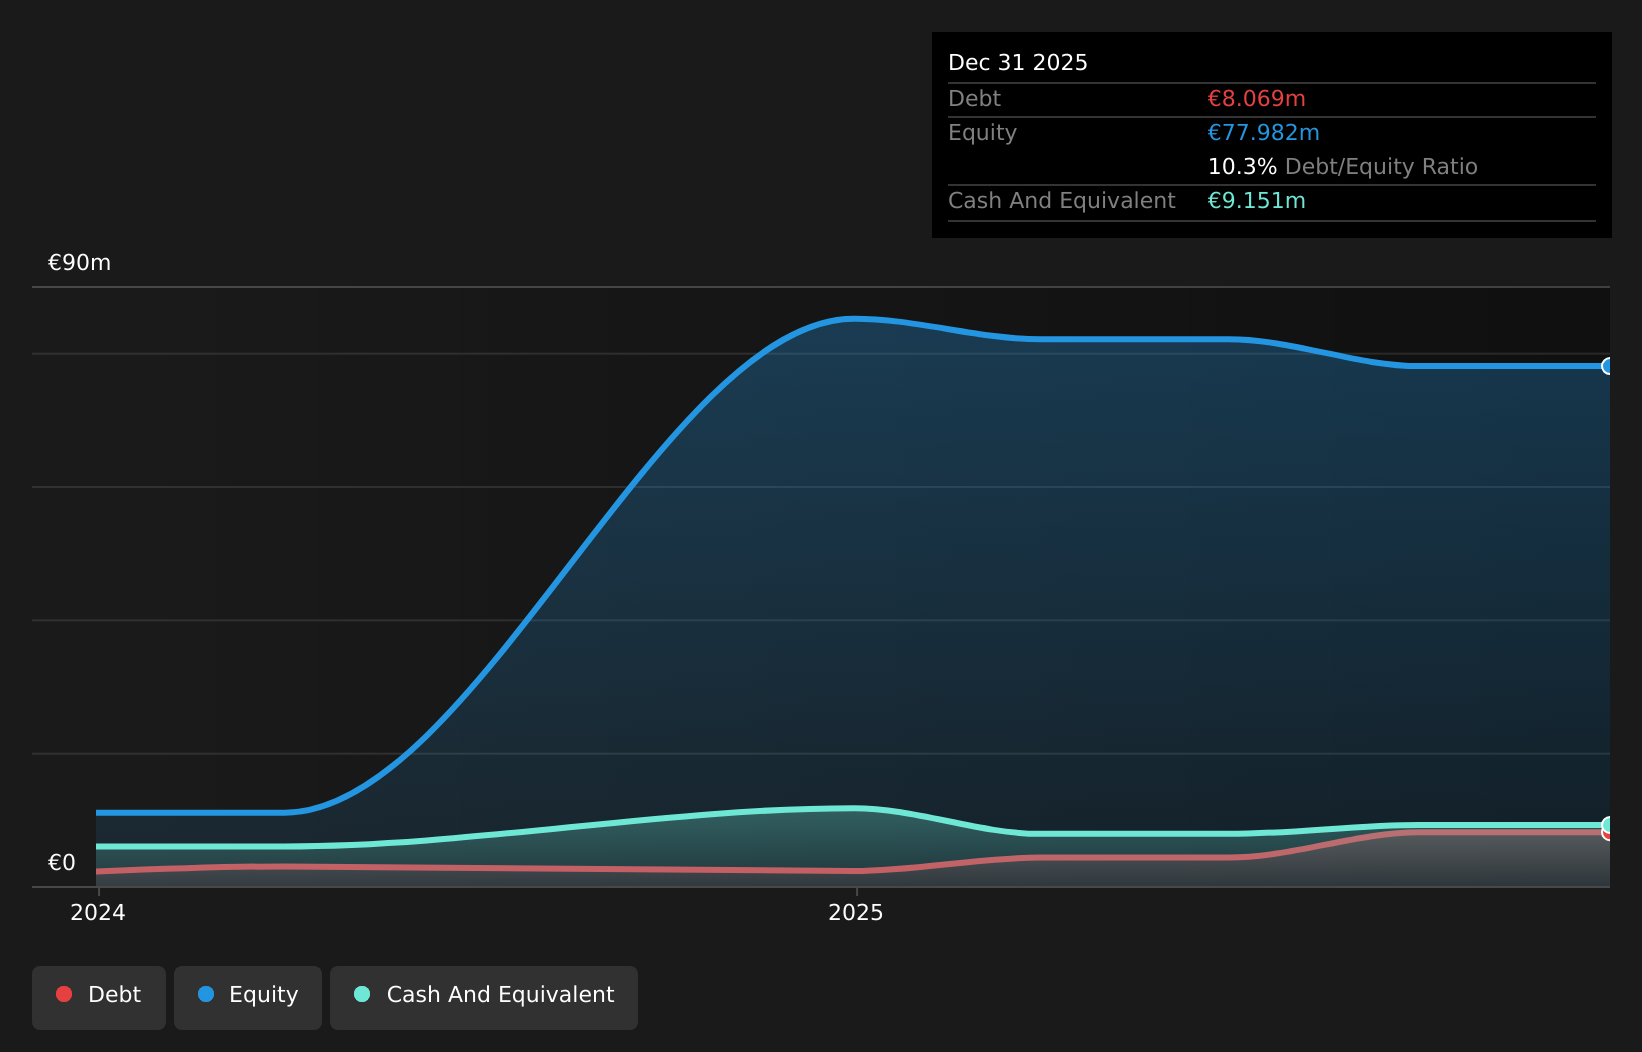
NAGA Group AG, with a market cap of €60.29 million, reported sales of €27.73 million for the first half of 2026, down from €32.32 million year-on-year but achieved a net income of €1.14 million compared to a net loss previously. Despite being unprofitable with negative return on equity and high volatility, NAGA's short-term assets exceed both its short-term and long-term liabilities, indicating financial stability in the near term. The company trades at a significant discount to estimated fair value and maintains earnings guidance for 2026 with expected revenue between €68–75 million, suggesting potential growth prospects amidst challenges.
- Take a closer look at NAGA Group's potential here in our financial health report.
- Gain insights into NAGA Group's future direction by reviewing our growth report.
Key Takeaways
- Unlock our comprehensive list of 279 European Penny Stocks by clicking here.
- Ready For A Different Approach? Rare earth metals are an input to most high-tech devices, military and defence systems and electric vehicles. The global race is on to secure supply of these critical minerals. Beat the pack to uncover the 32 best rare earth metal stocks of the very few that mine this essential strategic resource.
This article by Simply Wall St is general in nature. We provide commentary based on historical data and analyst forecasts only using an unbiased methodology and our articles are not intended to be financial advice. It does not constitute a recommendation to buy or sell any stock, and does not take account of your objectives, or your financial situation. We aim to bring you long-term focused analysis driven by fundamental data. Note that our analysis may not factor in the latest price-sensitive company announcements or qualitative material. Simply Wall St has no position in any stocks mentioned.
Have feedback on this article? Concerned about the content? Get in touch with us directly. Alternatively, email editorial-team@simplywallst.com