
- PRICING
- LIVE QUOTES
- LEARN
- HELP


EN
Alliant Energy (LNT) Is Getting Fresh Attention, What Is Behind It?
FranklinWH Energy Storage’s tie up with Alliant Energy (LNT) on the Smart Hours program gives Iowa customers financial incentives to discharge home battery power during peak demand and aligns household systems with grid reliability goals.
Alliant Energy’s recent Smart Hours push lands at a time when momentum has softened, with the share price down about 11% over the past 90 days after a recent 7 day share price return of 3.5%. Yet long term total shareholder returns of 49.9% over three years and 40.8% over five years show the stock has still rewarded patient investors.
Scan for other regulated utilities that are focusing on grid-ready storage programs and recurring customer incentives using our curated list of 43 power grid technology and infrastructure stocks.
The recent pullback leaves Alliant Energy roughly flat over one year yet still strong over three and five. Does that balance of near term wobble and longer term reward still stack up on valuation from here?
Price-to-Earnings of 21.4x: Is it justified?
On current numbers, Alliant Energy trades on a P/E of 21.4x, which puts the stock on a richer tag than both its peers and the level implied by fair-value modelling.
The P/E ratio compares what investors are paying for each dollar of earnings. For a regulated utility like Alliant Energy, that figure often reflects expectations around steady profit, capital intensity, and how predictable cash flows appear to be under its rate frameworks.
In this case, the market is assigning a higher P/E than the US Electric Utilities industry average of 20.4x, and also above the estimated fair P/E of 20.3x. That combination signals investors are paying up relative to sector norms and to the level the fair ratio suggests the valuation could move toward if enthusiasm cooled.
Explore the SWS fair ratio for Alliant Energy.
Result: Price-to-Earnings of 21.4x (OVERVALUED)
Still, that richer P/E could struggle if regulators tighten allowed returns or if higher funding costs affect how investors view Alliant Energy’s future projects.
Find out about the key risks to this Alliant Energy narrative.
Another view on Alliant Energy’s value
The P/E looks a bit rich, yet the SWS DCF model points in the opposite direction. On those cash flow estimates, Alliant Energy at $67.51 sits just below the modelled fair value of $67.71, which implies a slight undervaluation rather than a premium. So which signal should carry more weight in your process?
Look into how the SWS DCF model arrives at its fair value.
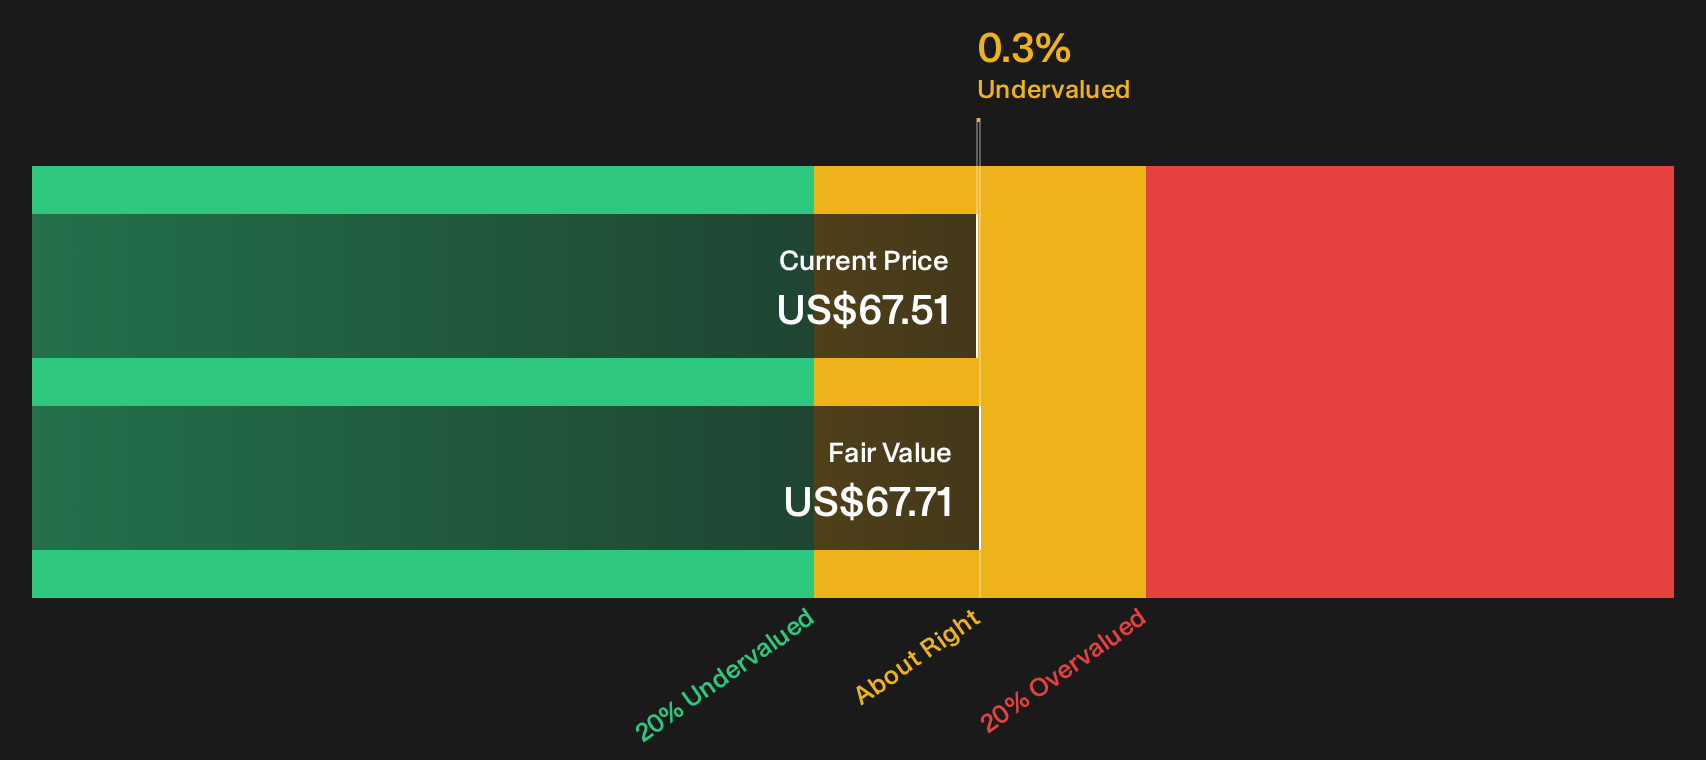
Simply Wall St performs a discounted cash flow (DCF) on every stock in the world every day (check out Alliant Energy for example). We show the entire calculation in full. You can track the result in your watchlist or portfolio and be alerted when this changes, or use our stock screener to discover 32 high quality undervalued stocks. If you save a screener we even alert you when new companies match - so you never miss a potential opportunity.
Next Steps
Mixed signals around Alliant Energy’s price and fundamentals can feel messy, so move quickly, review the detailed data, and form a view that fits your own risk tolerance using the full breakdown of 2 key rewards and 2 important warning signs
Looking for more Alliant Energy sized investment ideas?
If Alliant Energy has sharpened your thinking, do not stop here. Broaden your watchlist with fresh opportunities other investors may be overlooking right now.
- Target resilient balance sheets and steady fundamentals by scanning our curated list of solid balance sheet and fundamentals (25 results), which filters for financial strength before excitement.
- Hunt for quality at a reasonable tag by reviewing the 32 high quality undervalued stocks and focus on businesses that combine solid fundamentals with appealing prices.
- Prioritise stability and income potential by checking companies in the 7 dividend fortresses that offer higher yields with a focus on durability.
This article by Simply Wall St is general in nature. We provide commentary based on historical data and analyst forecasts only using an unbiased methodology and our articles are not intended to be financial advice. It does not constitute a recommendation to buy or sell any stock, and does not take account of your objectives, or your financial situation. We aim to bring you long-term focused analysis driven by fundamental data. Note that our analysis may not factor in the latest price-sensitive company announcements or qualitative material. Simply Wall St has no position in any stocks mentioned.
Have feedback on this article? Concerned about the content? Get in touch with us directly. Alternatively, email editorial-team@simplywallst.com