
- PRICING
- LIVE QUOTES
- LEARN
- HELP


EN
TriNet Group (TNET) Could Be 65% Below Fair Value Following Its HR Tools Rollout
TriNet Group (TNET) just rolled out a fresh wave of HR tools that target some of the most time consuming pain points for small and mid sized employers, including leave, hiring and spending.
TriNet Group’s latest product rollout lands after a strong near term run, with a 1 day share price return of 2.7%, a 7 day share price return of 6.3%, and a 90 day share price return of 16.2%. However, the 3 year total shareholder return has declined 41.8%, showing short term momentum against a weaker longer term record that may reflect shifting views on both growth potential and risk.
Compare TriNet Group’s momentum and product push with a curated set of HR and workplace-tech peers by scanning 92 AI infrastructure stocks, which is shaping how businesses run people operations more efficiently.
After a sharp near term rebound and with TriNet Group trading close to analyst targets but at a steep discount to some intrinsic value estimates, where does a reasonable fair value range actually land for this stock now?
Most Popular Narrative: 1% Overvalued
TriNet Group closed at $66.72 against a widely followed fair value estimate of $66.20, so the narrative pins the stock almost exactly in line with its modeled worth using a 7.93% discount rate.
The main factor that has to go right is that TriNet Group converts its AI tools, broader product set, and expanded distribution into sustained customer retention and high quality growth while maintaining cost discipline.
The current valuation suggests TriNet Group is fairly valued, with the market already reflecting continued execution on its healthcare repricing, AI and ASO build out, and cash generation profile.
See why 1 investors see TriNet Group as 1% overvalued.
Result: Fair Value of $66.20 (ABOUT RIGHT)
Still, pressure on TriNet Group’s worksite employee volumes and persistently high health cost trends could challenge both the fair value story and the AI driven optimism.
Find out about the key risks to this TriNet Group narrative.
Another View: TriNet Group And The Cash Flow Gap
Analysts as a group see TriNet Group as roughly fairly priced near $66, yet the SWS DCF model tells a very different story, with an estimated future cash flow value of $190.03 per share that points to the stock trading at about a 65% discount. Which story do you trust more, the earnings multiple or the cash flow math?
Look into how the SWS DCF model arrives at its fair value.
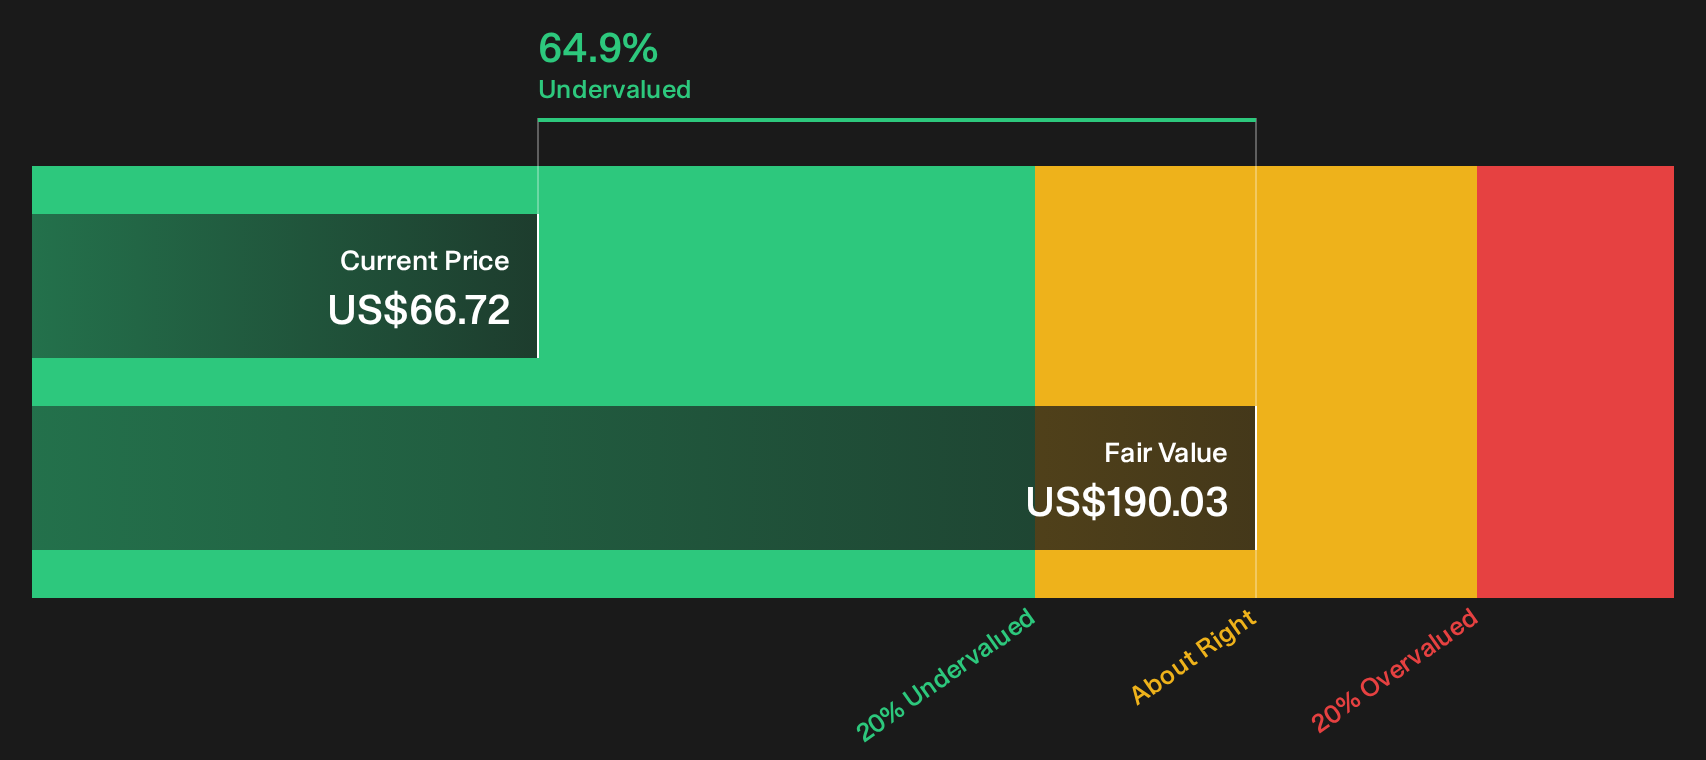
Simply Wall St performs a discounted cash flow (DCF) on every stock in the world every day (check out TriNet Group for example). We show the entire calculation in full. You can track the result in your watchlist or portfolio and be alerted when this changes, or use our stock screener to discover 32 high quality undervalued stocks. If you save a screener we even alert you when new companies match - so you never miss a potential opportunity.
Next Steps
The mixed tone in this TriNet Group story, with both caution and optimism in play, makes it worth checking the numbers yourself and moving quickly if your view differs from the crowd. To see the contrast between potential upside and the issues investors worry about, start with the 2 key rewards and 3 important warning signs.
Looking For More Investment Ideas Beyond TriNet Group?
If TriNet Group has sharpened your focus on pricing, risk and upside, do not stop here. Put the same discipline to work across a wider watchlist.
- Target resilient compounding potential by scanning companies with dependable cash flows and supportive balance sheets using the 32 high quality undervalued stocks.
- Prioritise staying power and sleep at night income streams by checking out the 8 dividend fortresses before the next income window closes.
- Hunt for future leaders that many investors overlook by running the 20 high quality undiscovered gems while they still trade off the radar.
This article by Simply Wall St is general in nature. We provide commentary based on historical data and analyst forecasts only using an unbiased methodology and our articles are not intended to be financial advice. It does not constitute a recommendation to buy or sell any stock, and does not take account of your objectives, or your financial situation. We aim to bring you long-term focused analysis driven by fundamental data. Note that our analysis may not factor in the latest price-sensitive company announcements or qualitative material. Simply Wall St has no position in any stocks mentioned.
Have feedback on this article? Concerned about the content? Get in touch with us directly. Alternatively, email editorial-team@simplywallst.com