
- PRICING
- LIVE QUOTES
- LEARN
- HELP


EN
Why Universal Music Group Fell Even As Sales Rose
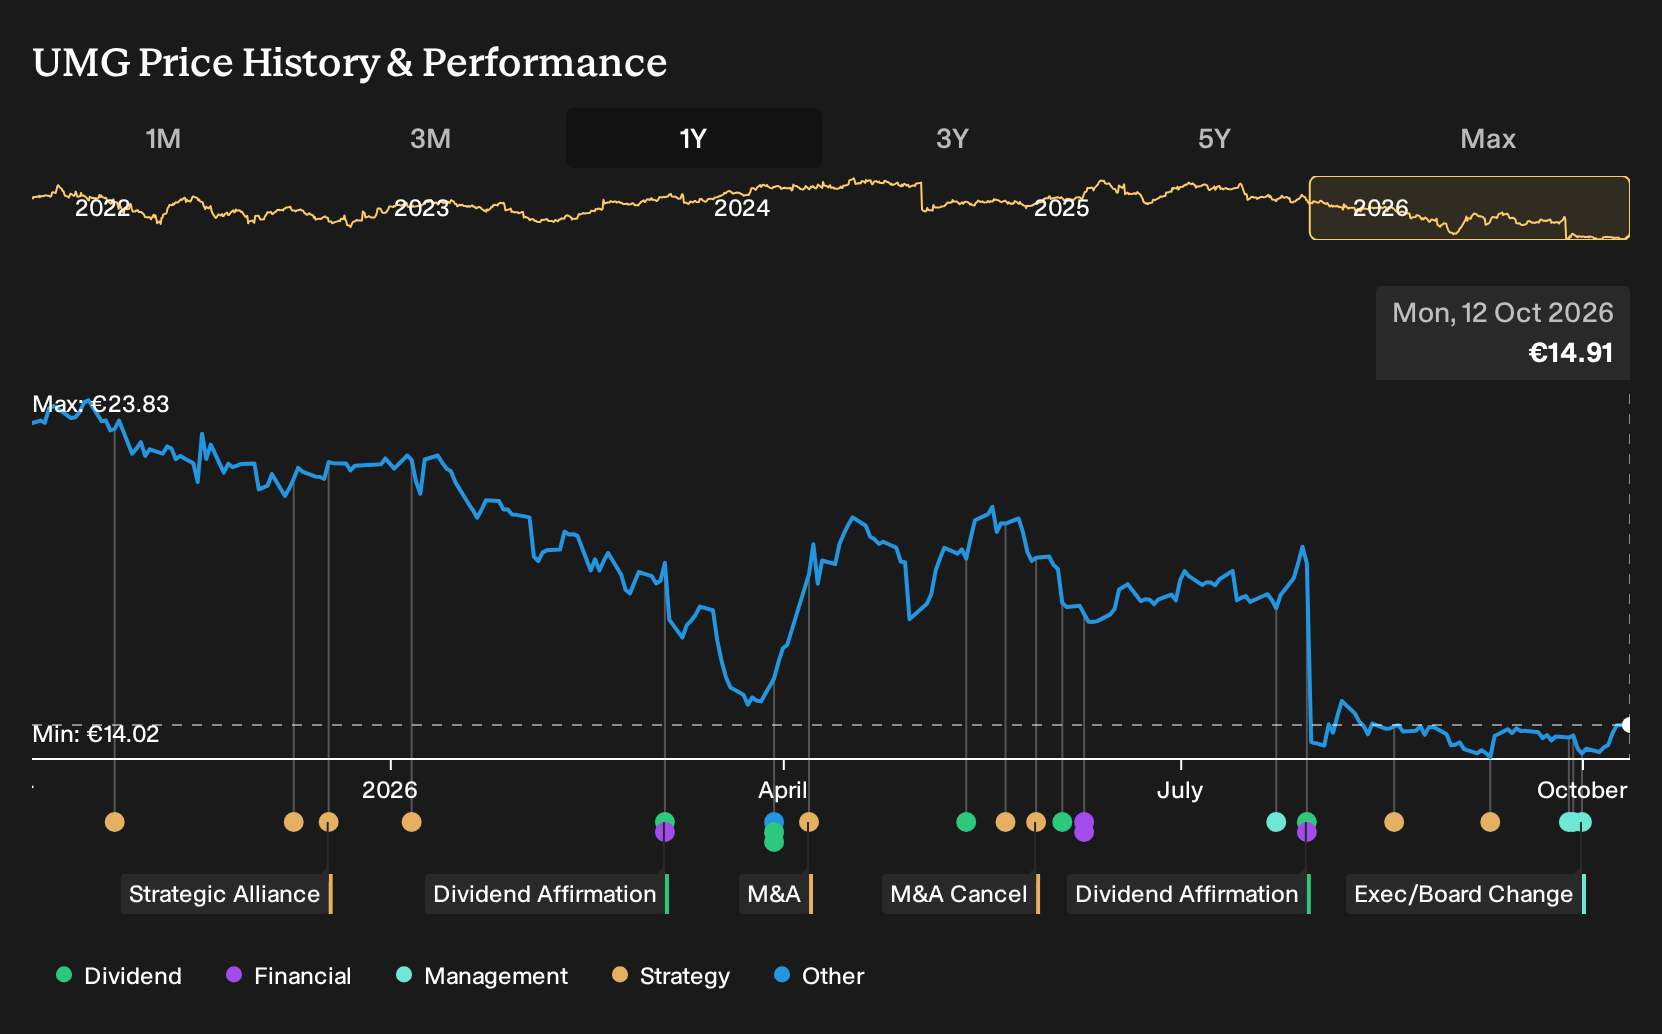
Universal Music Group spent the past year in the headlines, from rejecting Bill Ackman’s €64b takeover approach to ramping up share buybacks and AI deals, yet the experience for a holder was far from celebratory. For Universal Music Group shareholders, the loss over the past year was 33.9%, including dividends. If you had bought in a year ago on the streaming and catalog story, how much of this decline was already hinted at in what analysts and management were saying back on 2025-10-12?
If the move has made Universal Music Group harder to judge, start where the gap is still open and scan 179 high quality undervalued stocks.
The Two Universal Music Group Stories Investors Were Weighing
The shares cost €23.16 at the start of the period, and anyone looking at Universal Music Group back then had to choose which story felt more realistic.
The bullish narrative put Fair Value at €29.32, a rough guide to what the stock might be worth if its assumptions played out, built on paid music streaming adoption and higher ARPU. That view leaned on expectations of 6.0% annual revenue growth, with Streaming 2.0 deals feeding recurring income even as profit margins were assumed to shrink to 13.8%.
The bearish camp saw Fair Value at €22, again a price implied by its own more cautious framework, with AI music and cheaper independent content eroding catalog economics. In that version, revenue was still assumed to grow 4.7% a year, but earnings were expected to fall to €1.7b and margins to compress to 12.5%, with superstar dependence adding extra earnings risk.
What The Facts Did To The Universal Music Group Argument
Universal Music Group’s H1 2026 report showed revenue at €6,194m versus €5,881m a year earlier, but net income dropped to €222m from €1,432m and net margin slid from 24.3% to 3.6%. That profit squeeze challenged the optimistic case that higher streaming ARPU and Streaming 2.0 deals would support healthier earnings, so the evidence leaned toward the cautious story.
The key lesson is about which promise to trust. When a thesis leans on efficiency and margin resilience, you would track net margin and absolute profit in each report and test whether cost and legal spending are moving in the direction the story implied.
What Universal Music Group’s Drop Leaves You Weighing Today
Universal Music Group trades at €14.91 today, a level where the selected bullish Narrative argues that fair value sits above the current price based on catalog depth, margin structure and balance sheet strength rather than short term streaming wobbles.
The argument hinges on whether UMG’s larger catalogue share and independent-services reach really deserve a higher multiple than a smaller peer. A buyer at this level must judge whether current execution issues are temporary while the long life catalog economics remain intact.
"The important conclusion is simpler: there is no material quality premium currently embedded in UMG's operating valuation. Yet the underlying assets are not equivalent. UMG controls approximately 39.76% of U.S. catalogue consumption, versus 19.80% for Warner."
One Narrative disagrees with today's price. → See where this Narrative says Universal Music Group should trade
Find Your Own Contrarian Opportunity
Passing on this one could have spared you a loss. Where might you find the opposite surprise? Start looking for companies whose prices leave room for a better outcome than investors expect. These three trade below our estimated value.
- Company 1 - 50% below our estimate - builds higher content service packages around dual fuel engines under long term service agreements.
- Company 2 - 43% below our estimate - turns complex product failures, AI projects, and regulatory disputes into recurring science and engineering assignments.
- Company 3 - 25% below our estimate - uses a single high margin mine to fund drilling that extends surrounding resource life.
That is three of the list. See all 202 companies with the balance sheet to back it up →
This article by Simply Wall St is general in nature. We provide commentary based on historical data and analyst forecasts only using an unbiased methodology and our articles are not intended to be financial advice. It does not constitute a recommendation to buy or sell any stock, and does not take account of your objectives, or your financial situation. We aim to bring you long-term focused analysis driven by fundamental data. Note that our analysis may not factor in the latest price-sensitive company announcements or qualitative material. Simply Wall St has no position in any stocks mentioned.
Have feedback on this article? Concerned about the content? Get in touch with us directly. Alternatively, email editorial-team@simplywallst.com