
- PRICING
- LIVE QUOTES
- LEARN
- HELP


EN
This Key Indicator Warns That the Bottom of the Stock Market Keeps Getting Closer to Falling Out
The three-month rolling correlation between the S&P 500 Index ($SPX) and its largest constituent stocks has plunged to the lowest level in at least 15 years. In plain English, that means the “stock market” is not reflecting what the majority of stocks are actually doing.
However, with so much money in the S&P 500 Index and ETFs like SPY, VOO and IVV, it begs the question: if the top-heavy index runs into trouble, can the other 450+ laggards pick up the slack?
Interestingly, they very well might. But whether they do or don’t, the result is likely to be the same.
If the biggest stocks crater, the others are too insignificant in size to do anything other than howl at the moon.
More likely, the correlation comes back together and stocks move in sync. To the downside. That’s what the odds favor. That’s what I see here.
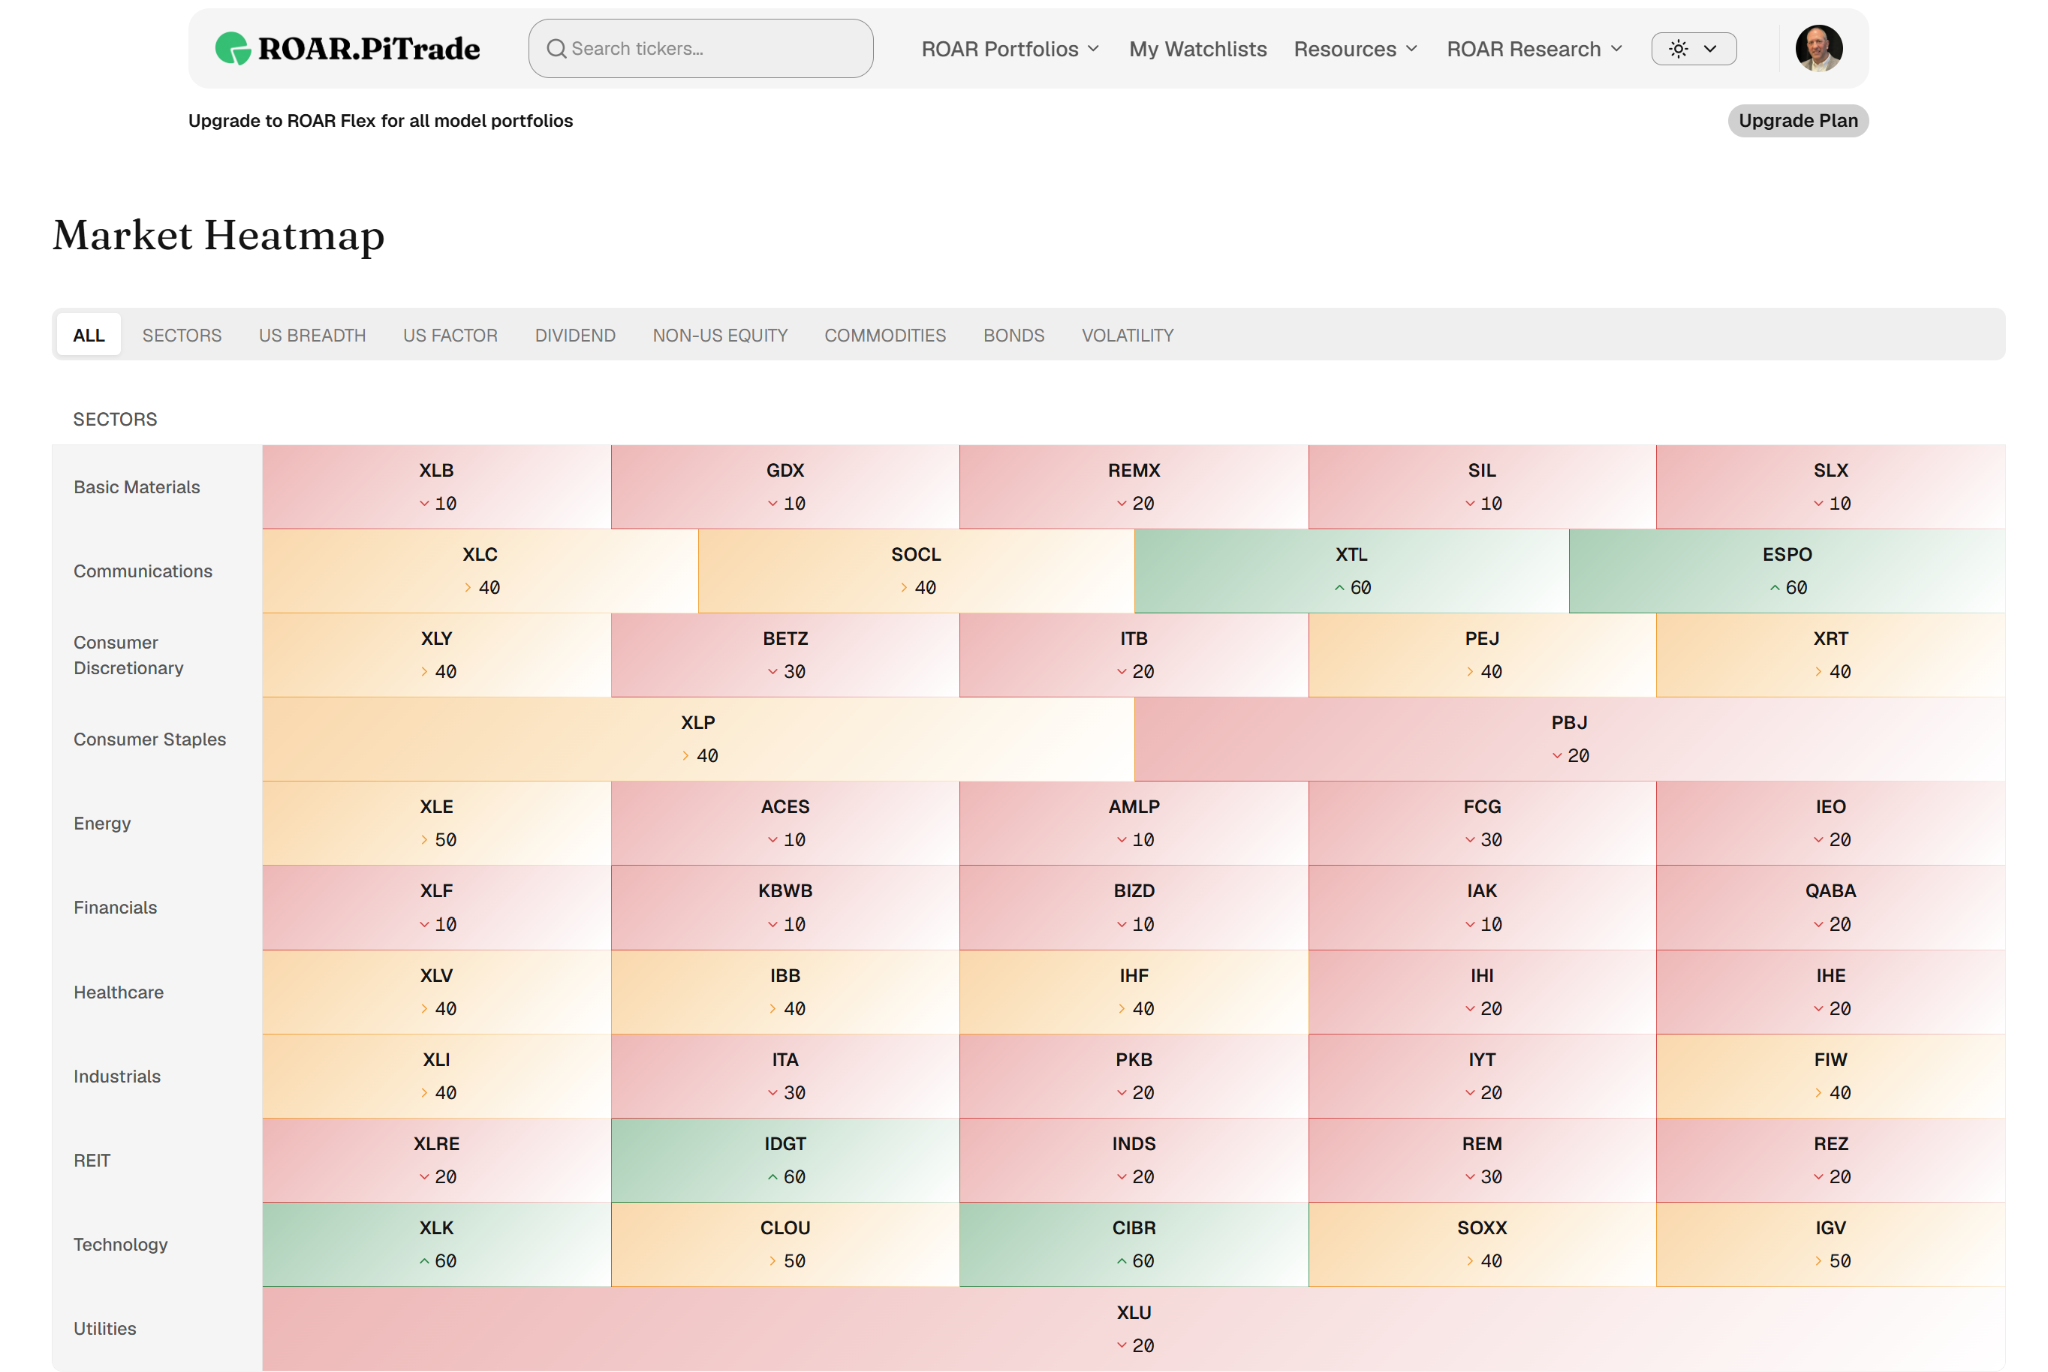
That busy table above shows the 11 S&P sector SPDR ETFs in the leftmost column. XLK, the tech sector, still has a ROAR Score of 60, indicating that return potential is still skewed slightly bullish.
The other 10 sectors can not be characterized that way. They are much weaker. And XLE, the energy sector, is only as viable as Middle East war headlines.
Beyond that, if we look to the right of that first column, we see the rest of my ROAR “market carpet.” A sea of red and a bit of yellow. A few isolated patches of green, but not in what I’d call heavily weighted industry groups within the S&P 500. It all adds up to an overwhelming number of stocks that are acting like it will get worse before it gets better.
A few mega-cap tech heavyweights hold the benchmark near all-time highs while individual sectors, cyclicals, and small-cap stocks roll over one by one behind the scenes. I’ve seen this and documented it here for months.
This is one of many ways to visualize it. The ProShares S&P 500 Ex-Technology ETF (SPXT) is the S&P 500 without tech stocks, and the Invesco S&P 500 Equal Weight ETF (RSP) is the equal-weighted index.
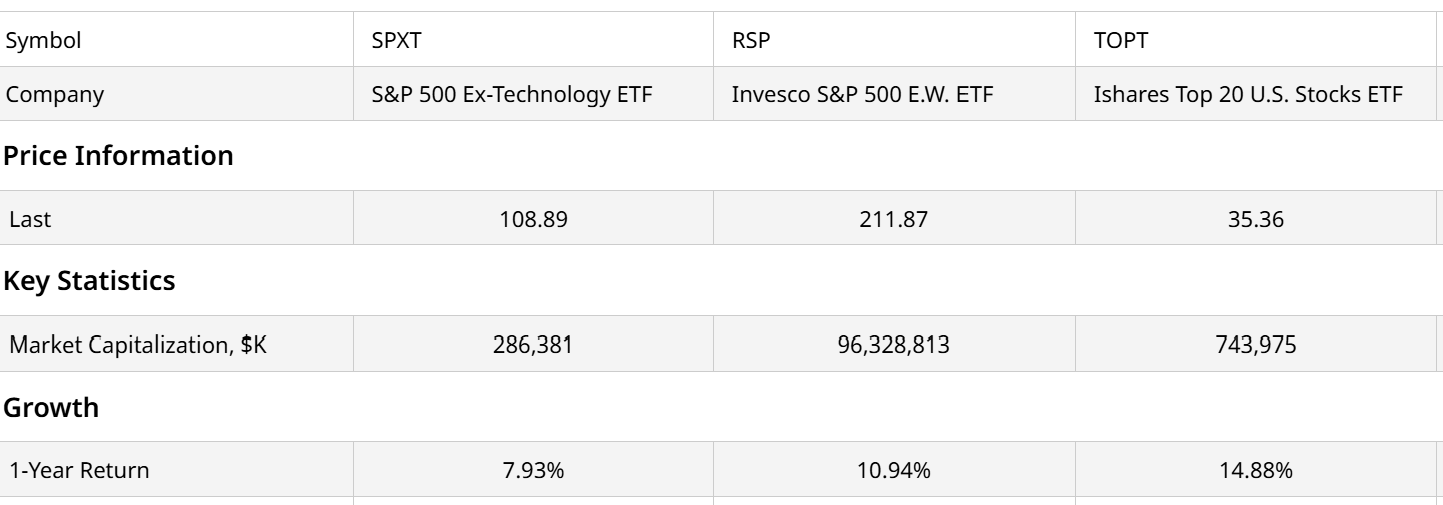
Compare those to the iShares Top 20 U.S. Stocks ETF (TOPT), the 20 biggest S&P 500 stocks, over the past 12 months. No contest. In fact, I suspect that those 20 stocks account for most of the gains in the other two ETFs.
During the initial low correlation phase, top stocks decouple and the broad market quietly fades, sector and stock after sector and stock. Then at some point, the bottom falls out. Not yet in this cycle. But this chart indicates to me that it is a growing possibility.
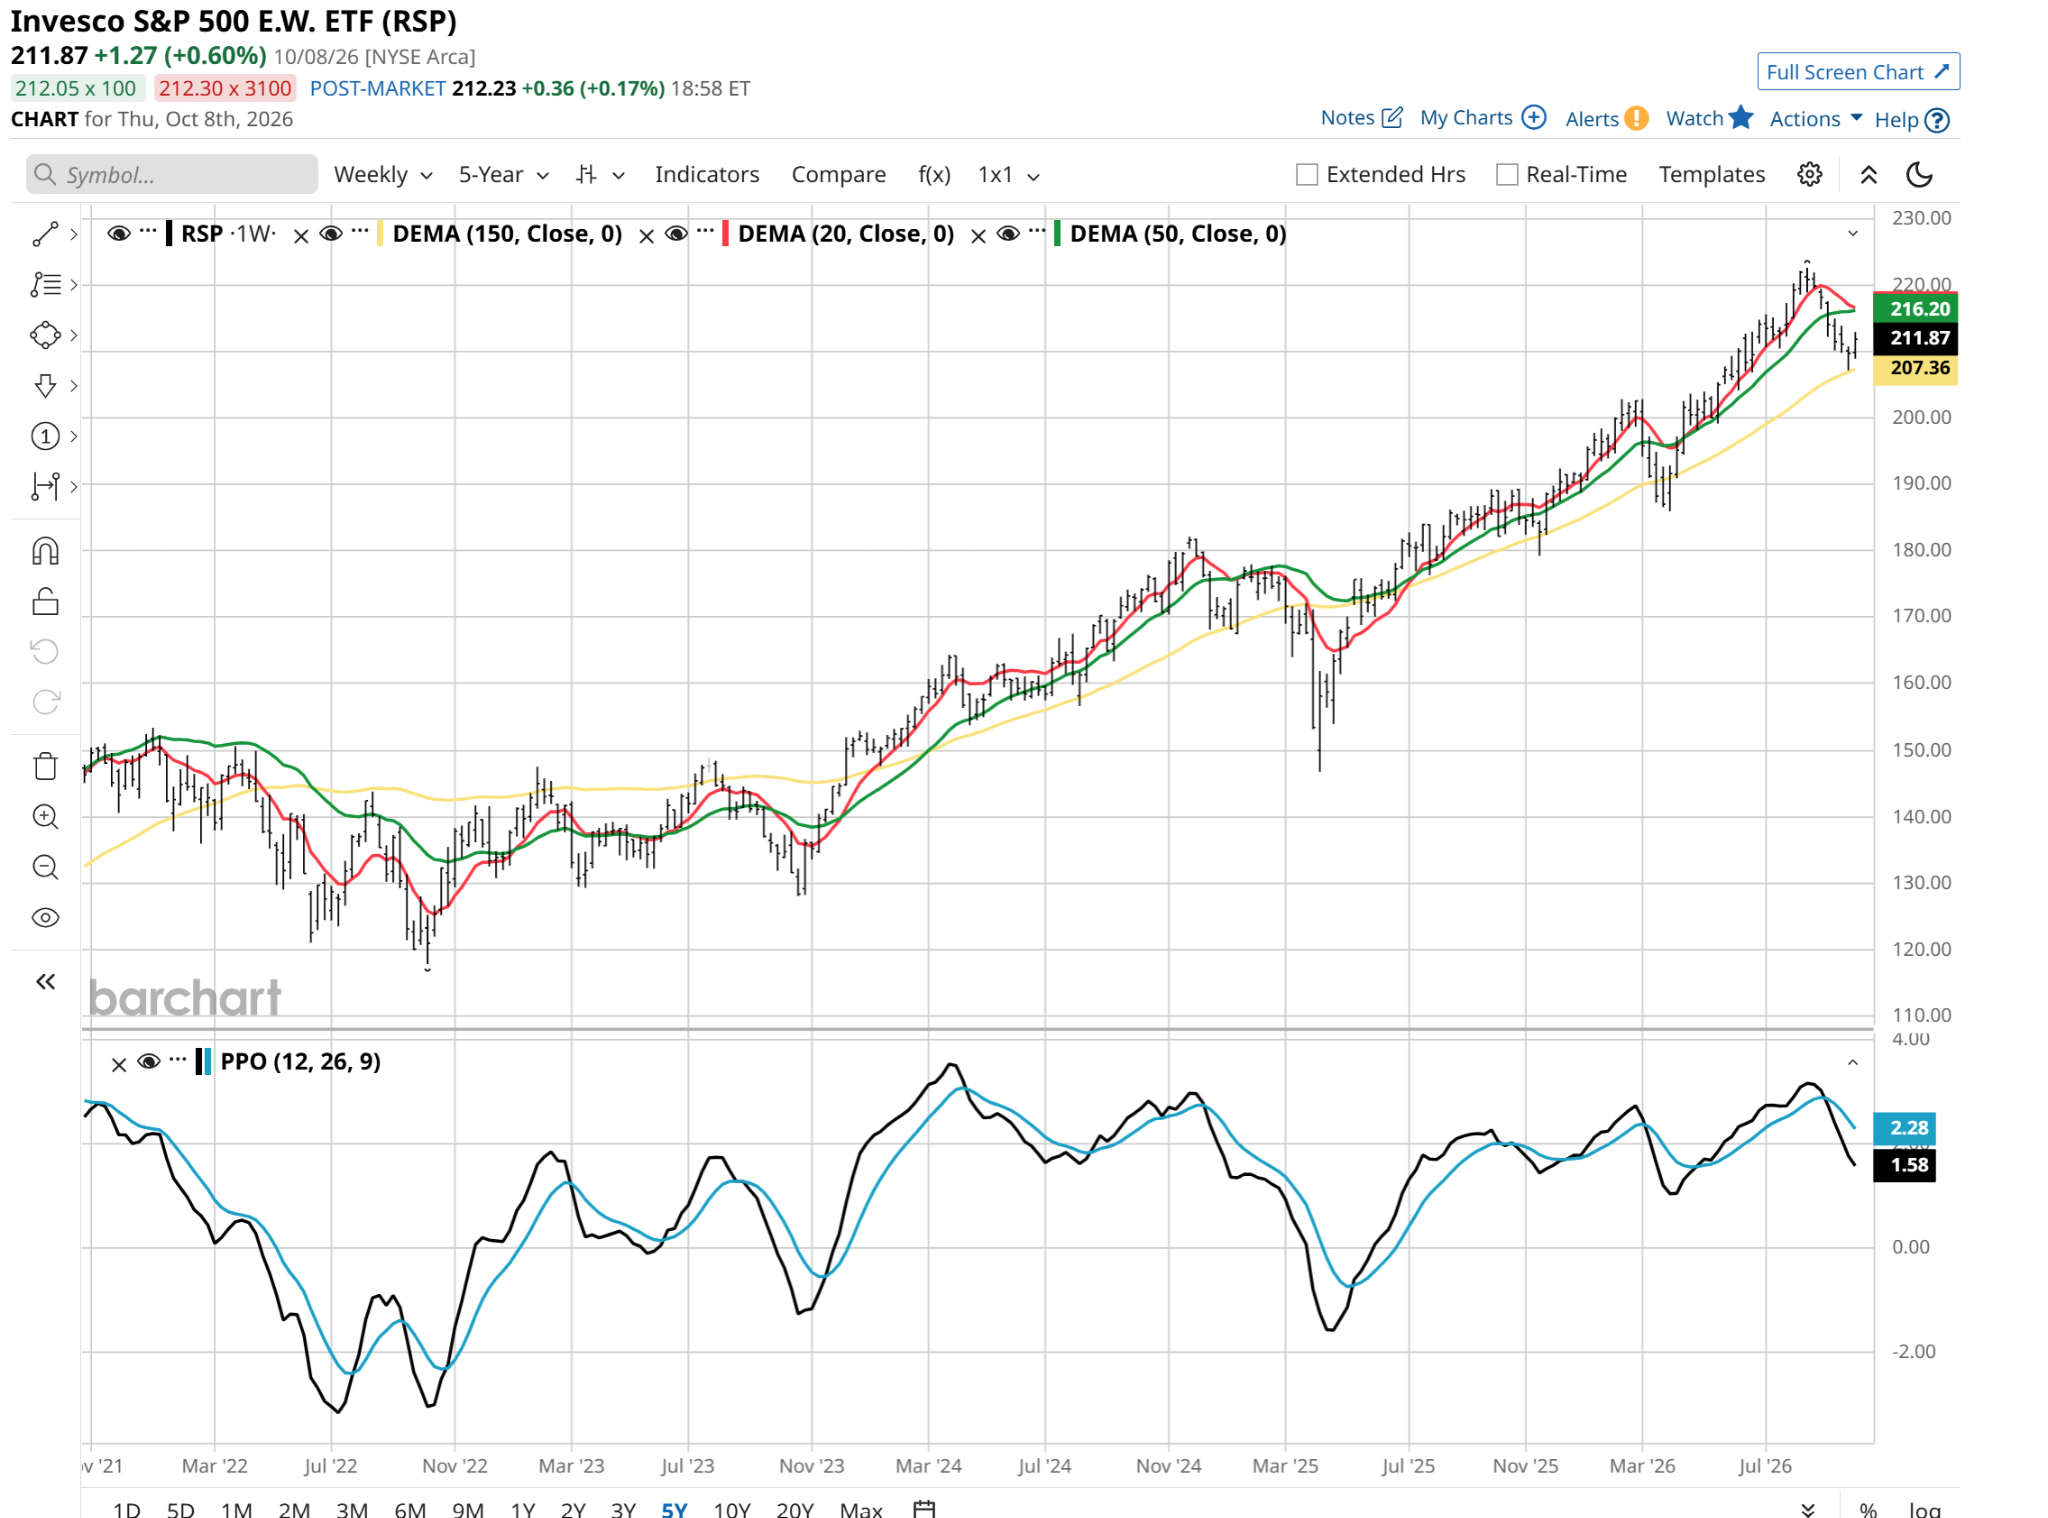
That’s a weekly chart of RSP, and it tells me that beyond an expected bounce, the market is closer to sinking under its own weight. Too late to save itself? No, it is never too late. But it is getting late.
Late-Cycle Gravity: Year Five of the Bull Market
Context is critical when evaluating these types of conditions. The current bull market is entering its fifth year, making it the sixth-longest of the 24 bull market cycles since 1932.
While near-term momentum can keep headline indexes elevated for brief stretches, when a mature bull market is surviving on broken internal “breadth” and 15-year record low constituent correlations, the margin of safety is about gone.
Chasing top-heavy mega-caps at record low correlation levels is a game of diminishing returns. My approach has shifted strongly toward short-term holding periods for stocks, if I own single stocks at all.
They are all “rented” and not owned. That’s how downside risk management can be effected, much easier.
Rob Isbitts is a semi-retired CIO, former fiduciary investment advisor, Barchart columnist, and professional straight-talker. Download his new free e-book on hedged bond investing for retirement at ETFYourself.com. His research and model portfolios are at ROAR.PiTrade.com.
On the date of publication, Rob Isbitts did not have (either directly or indirectly) positions in any of the securities mentioned in this article. All information and data in this article is solely for informational purposes. For more information please view the Barchart Disclosure Policy here.