
- PRICING
- LIVE QUOTES
- LEARN
- HELP


EN
October 2026's European Stocks That May Be Trading Below Their Estimated Value
In October 2026, European markets have experienced volatility due to renewed Middle East tensions, a more hawkish European Central Bank stance, and mixed economic indicators across the region. Despite these challenges, investors are keenly searching for opportunities in stocks that may be trading below their estimated value. Identifying undervalued stocks often involves looking for companies with strong fundamentals that might be temporarily overlooked by the market amidst broader uncertainties.
Top 10 Undervalued Stocks Based On Cash Flows In Europe
| Name | Current Price | Fair Value (Est) | Discount (Est) |
| Valmet Oyj (HLSE:VALMT) | €26.62 | €52.96 | 49.7% |
| Sentia (OB:SNTIA) | NOK81.00 | NOK155.12 | 47.8% |
| Promotica (BIT:PMT) | €3.02 | €5.95 | 49.2% |
| Orthex Oyj (HLSE:ORTHEX) | €4.50 | €8.89 | 49.4% |
| Lindab International (OM:LIAB) | SEK127.10 | SEK251.27 | 49.4% |
| Koninklijke BAM Groep (ENXTAM:BAMNB) | €11.67 | €22.78 | 48.8% |
| Huuuge (WSE:HUG) | PLN23.15 | PLN45.81 | 49.5% |
| Grupa Pracuj (WSE:GPP) | PLN55.50 | PLN108.78 | 49% |
| DWS Group GmbH KGaA (XTRA:DWS) | €66.80 | €127.67 | 47.7% |
| Apator (WSE:APT) | PLN25.60 | PLN49.34 | 48.1% |
Underneath we present a selection of stocks filtered out by our screen.
Sanlorenzo (BIT:SL)
Overview: Sanlorenzo S.p.A. is an Italian company that designs, builds, and sells boats and pleasure boats across various international markets, with a market cap of €1.24 billion.
Operations: The company's revenue is derived from four main segments: Yacht Division (€581.46 million), Bluegame Division (€88.21 million), Superyacht Division (€361.42 million), and Nautor Swan Division (€122.40 million).
Estimated Discount To Fair Value: 27.8%
Sanlorenzo S.p.A. appears undervalued based on cash flows, trading at €35, significantly below its estimated future cash flow value of €48.45 and 27.8% under fair value estimates. Despite slower revenue growth forecasts compared to the Italian market, recent earnings grew by 3.5%, with net income reaching €49.13 million for H1 2026, up from last year’s figures. Analysts expect a potential stock price rise of 33.8%.
- Our comprehensive growth report raises the possibility that Sanlorenzo is poised for substantial financial growth.
- Delve into the full analysis health report here for a deeper understanding of Sanlorenzo.
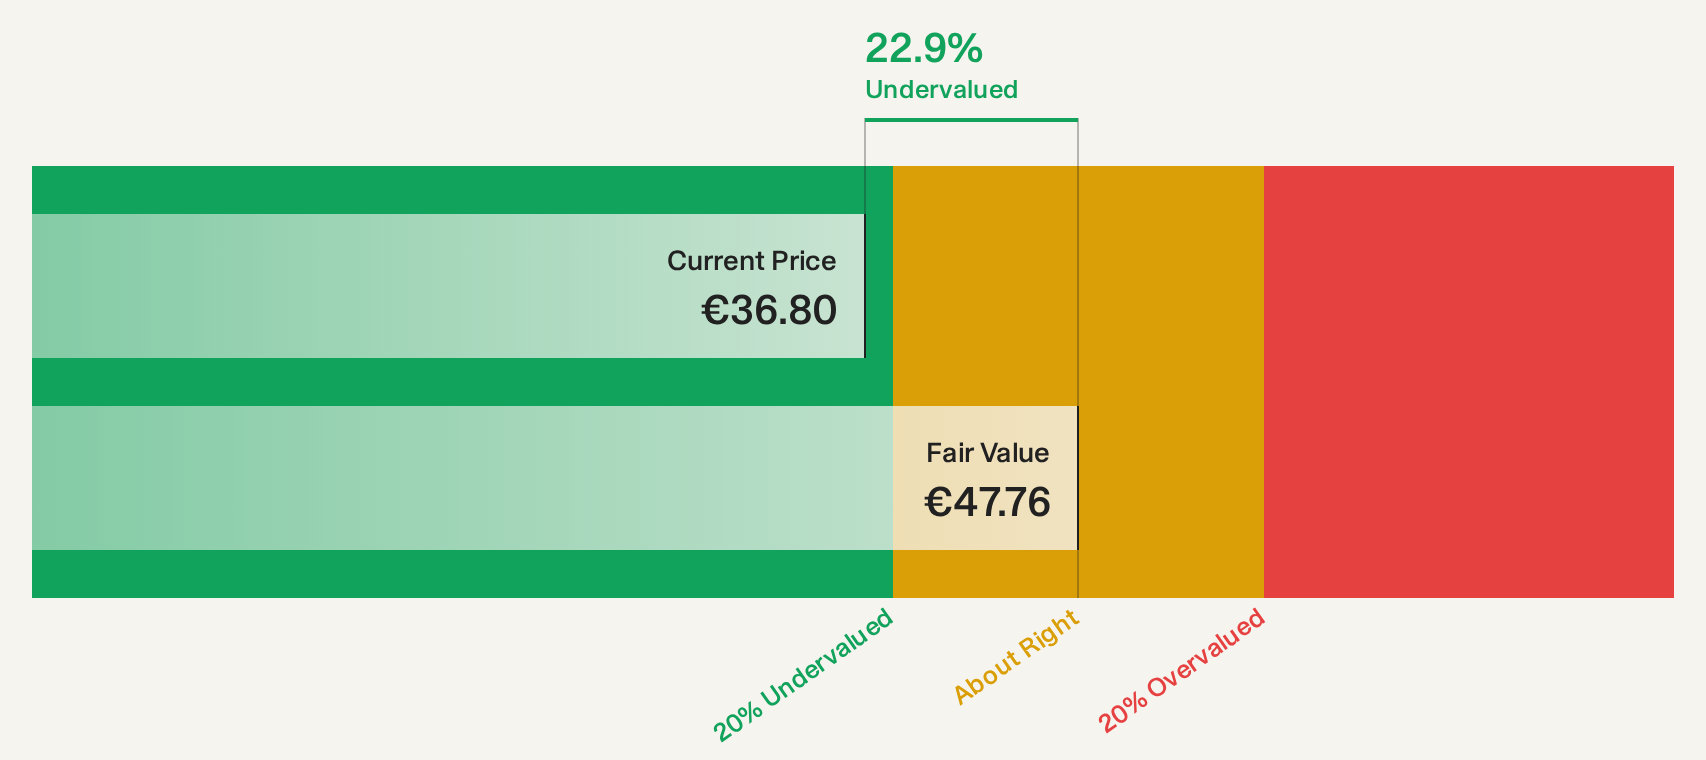
Unipol Assicurazioni (BIT:UNI)
Overview: Unipol Assicurazioni S.p.A., along with its subsidiaries, offers insurance products and services mainly in Italy and has a market cap of €18.22 billion.
Operations: The company's revenue is primarily derived from its Insurance - Non-Life Business segment at €10.34 billion and the Insurance - Life Business segment at €1.01 billion, with additional contributions from Banking Associates totaling €672 million.
Estimated Discount To Fair Value: 18.4%
Unipol Assicurazioni S.p.A. is trading at €25.4, below its estimated future cash flow value of €31.12 and 18.4% under fair value estimates, indicating potential undervaluation based on cash flows. Recent earnings for H1 2026 showed significant growth with net income rising to €883 million from €600 million a year ago, despite slower forecasted earnings growth compared to the Italian market. A recent rights offering raised approximately €2.5 billion, potentially impacting shareholder value in the short term.
- Our expertly prepared growth report on Unipol Assicurazioni implies its future financial outlook may be stronger than recent results.
- Click here to discover the nuances of Unipol Assicurazioni with our detailed financial health report.
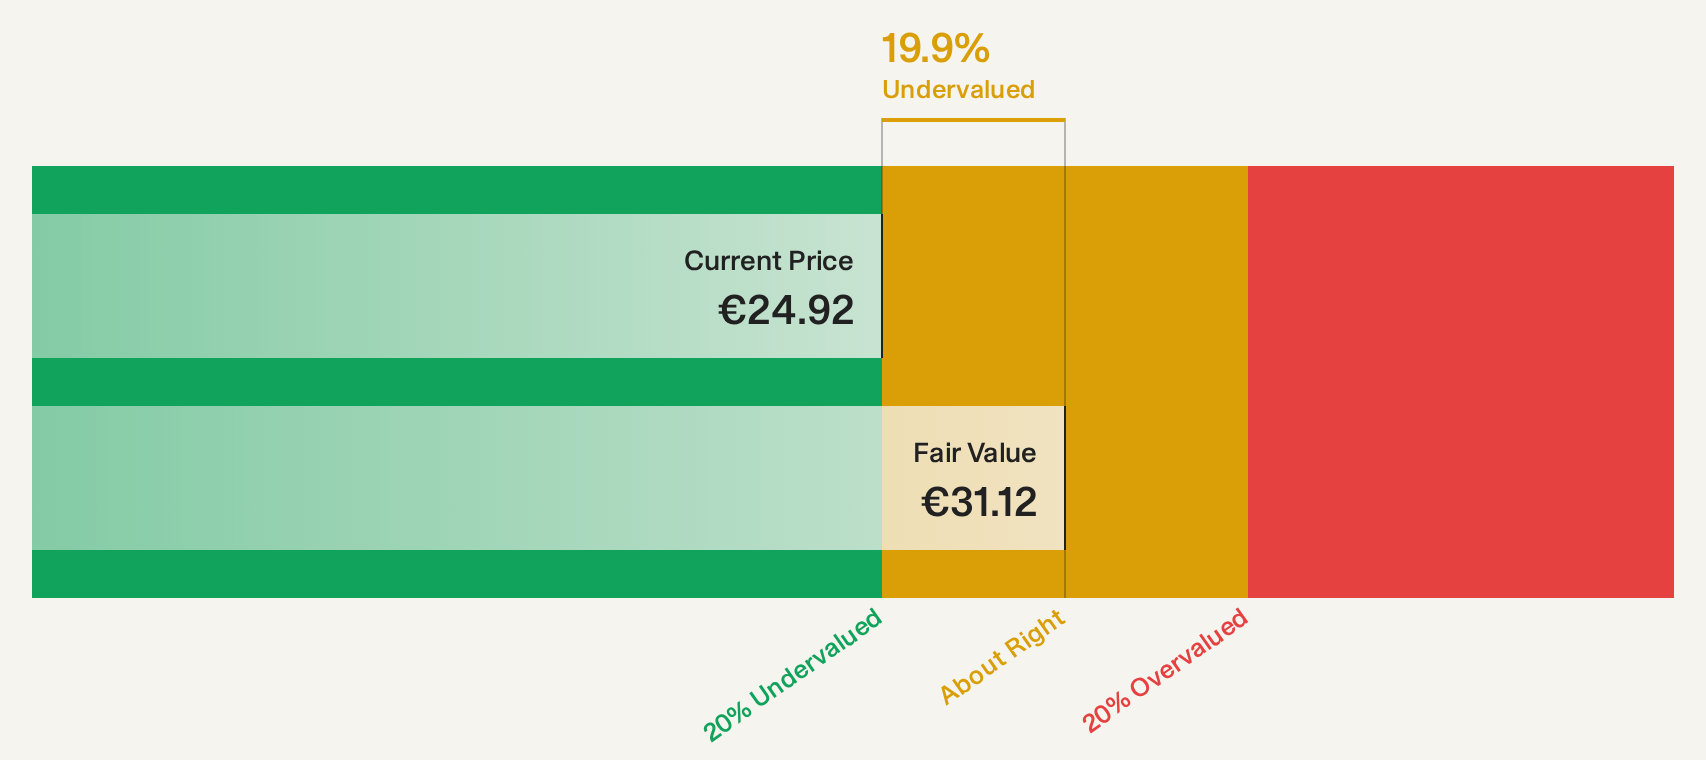
Valmet Oyj (HLSE:VALMT)
Overview: Valmet Oyj develops and supplies process technologies, automation, and services for the pulp, paper, and energy industries across various regions including North America, Latin America, EMEA, China, and Asia-Pacific with a market cap of €4.90 billion.
Operations: Valmet Oyj's revenue is primarily derived from its Biomaterial Solutions and Services segment, which generated €3.85 billion, and its Process Performance Solutions segment, contributing €1.48 billion.
Estimated Discount To Fair Value: 49.7%
Valmet Oyj is trading at €26.62, significantly below its estimated future cash flow value of €52.96, highlighting potential undervaluation based on cash flows. Recent earnings growth was strong, with net income reaching €74 million in Q2 2026 from €28 million the previous year. However, forecasted revenue growth of 2.4% per year lags behind the Finnish market average of 5.4%. Despite volatility and a recent index drop, Valmet maintains a reliable dividend yield of 5.07%.
- In light of our recent growth report, it seems possible that Valmet Oyj's financial performance will exceed current levels.
- Navigate through the intricacies of Valmet Oyj with our comprehensive financial health report here.
Summing It All Up
- Access the full spectrum of 62 Undervalued European Stocks Based On Cash Flows by clicking on this link.
- Have you diversified into these companies? Leverage the power of Simply Wall St's portfolio to keep a close eye on market movements affecting your investments.
- Invest smarter with the free Simply Wall St app providing detailed insights into every stock market around the globe.
Ready To Venture Into Other Investment Styles?
- Explore high-performing small cap companies that haven't yet garnered significant analyst attention.
- Diversify your portfolio with solid dividend payers offering reliable income streams to weather potential market turbulence.
- Fuel your portfolio with companies showing strong growth potential, backed by optimistic outlooks both from analysts and management.
This article by Simply Wall St is general in nature. We provide commentary based on historical data and analyst forecasts only using an unbiased methodology and our articles are not intended to be financial advice. It does not constitute a recommendation to buy or sell any stock, and does not take account of your objectives, or your financial situation. We aim to bring you long-term focused analysis driven by fundamental data. Note that our analysis may not factor in the latest price-sensitive company announcements or qualitative material. Simply Wall St has no position in any stocks mentioned.
Have feedback on this article? Concerned about the content? Get in touch with us directly. Alternatively, email editorial-team@simplywallst.com