
- PRICING
- LIVE QUOTES
- LEARN
- HELP


EN
European Equities Possibly Priced Below Market Estimates October 2026
European equities have experienced a week of volatility, influenced by heightened Middle East tensions, a hawkish stance from the European Central Bank, and mixed economic indicators across the eurozone. Despite these challenges, some stocks may be priced below market estimates, presenting potential opportunities for investors seeking value in an uncertain environment. Identifying undervalued stocks often involves looking at companies with strong fundamentals that are not fully reflected in their current valuations amidst broader market fluctuations.
Top 10 Undervalued Stocks Based On Cash Flows In Europe
| Name | Current Price | Fair Value (Est) | Discount (Est) |
| Valmet Oyj (HLSE:VALMT) | €26.62 | €52.96 | 49.7% |
| Sentia (OB:SNTIA) | NOK81.00 | NOK155.12 | 47.8% |
| Promotica (BIT:PMT) | €3.02 | €5.95 | 49.2% |
| Orthex Oyj (HLSE:ORTHEX) | €4.50 | €8.89 | 49.4% |
| Lindab International (OM:LIAB) | SEK127.10 | SEK251.27 | 49.4% |
| Koninklijke BAM Groep (ENXTAM:BAMNB) | €11.67 | €22.78 | 48.8% |
| Huuuge (WSE:HUG) | PLN23.15 | PLN45.81 | 49.5% |
| Grupa Pracuj (WSE:GPP) | PLN55.50 | PLN108.78 | 49% |
| DWS Group GmbH KGaA (XTRA:DWS) | €66.80 | €127.67 | 47.7% |
| Apator (WSE:APT) | PLN25.60 | PLN49.34 | 48.1% |
Here's a peek at a few of the choices from the screener.
Vicat (ENXTPA:VCT)
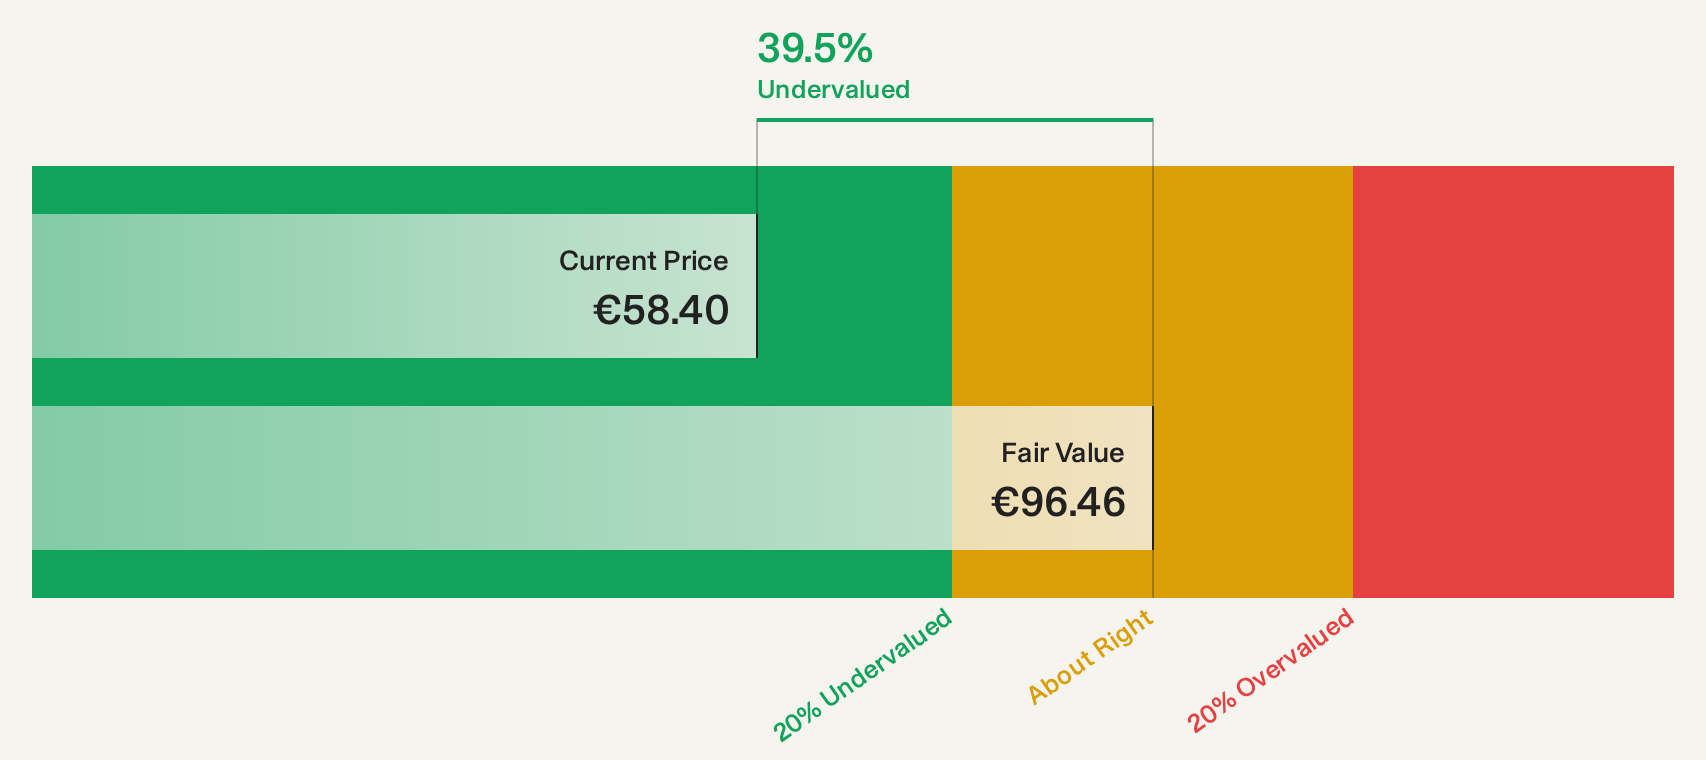
Overview: Vicat S.A., along with its subsidiaries, operates in the construction industry by producing and selling cement, ready-mixed concrete, and aggregates, with a market cap of €2.59 billion.
Operations: The company's revenue is primarily derived from its Cement segment at €2.49 billion and Concrete & Aggregates segment at €1.54 billion.
Estimated Discount To Fair Value: 39.6%
Vicat is trading at a significant discount to its estimated future cash flow value of €96.38, presenting potential for investors seeking undervalued opportunities based on cash flows. Despite slower revenue and earnings growth forecasts compared to the French market, Vicat maintains a reliable dividend yield of 3.44%. Recent strategic alliances, such as the VALèreCO project, enhance its sustainability initiatives by producing alternative fuels for cement plants, potentially strengthening long-term operational efficiencies and environmental impact reduction.
- Insights from our recent growth report point to a promising forecast for Vicat's business outlook.
- Navigate through the intricacies of Vicat with our comprehensive financial health report here.
Marimekko Oyj (HLSE:MEKKO)
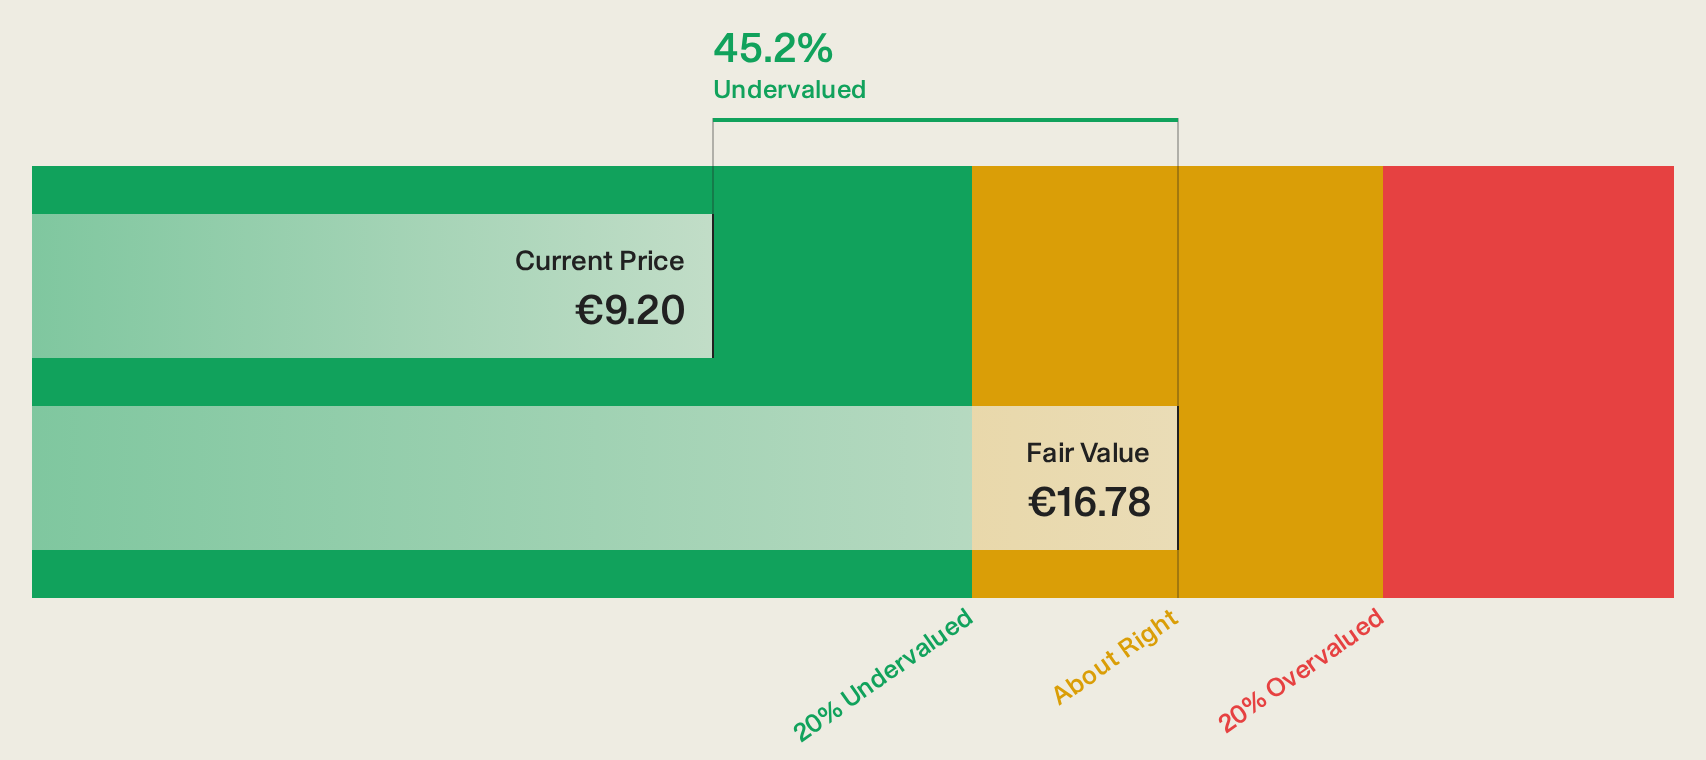
Overview: Marimekko Oyj is a lifestyle design company that designs, manufactures, and sells clothing, bags and accessories, and interior decoration products globally with a market cap of €375.26 million.
Operations: The company's revenue segment, Marimekko Business, generated €190.80 million.
Estimated Discount To Fair Value: 44%
Marimekko Oyj, trading at €9.27, is significantly undervalued based on its estimated future cash flow value of €16.56, offering potential for investors focused on cash flow metrics. Despite modest revenue growth forecasts of 5.1% per year, the company maintains a strong return on equity forecast of 32.3% in three years and offers a reliable dividend yield of 4.53%. Recent inclusion in the S&P Global BMI Index and strategic collaborations could enhance brand visibility and market reach.
- The analysis detailed in our Marimekko Oyj growth report hints at robust future financial performance.
- Unlock comprehensive insights into our analysis of Marimekko Oyj stock in this financial health report.
Synektik Spólka Akcyjna (WSE:SNT)
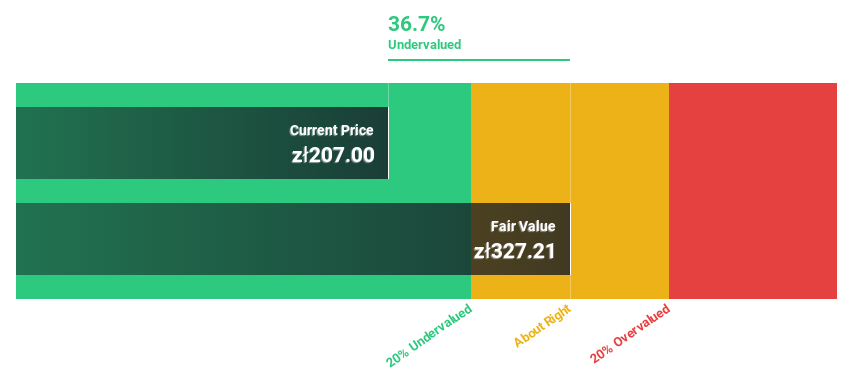
Overview: Synektik Spólka Akcyjna is a Polish company that offers products, services, and IT solutions for surgery, diagnostic imaging, and nuclear medicine applications with a market cap of PLN2.93 billion.
Operations: The company's revenue primarily comes from Diagnostic and IT Equipment, generating PLN889.20 million, and the Production of Radio Pharmaceuticals, contributing PLN55.61 million.
Estimated Discount To Fair Value: 30%
Synektik Spólka Akcyjna is trading at PLN 344, notably below its estimated future cash flow value of PLN 491.76, highlighting its undervaluation based on cash flows. Despite a forecasted earnings decline of 25.3% annually over the next three years, revenue is expected to grow by 6.4% per year, surpassing the Polish market rate. Recent financials show substantial growth with third-quarter revenue reaching PLN 292.26 million and net income at PLN 55.08 million, reflecting strong operational performance.
- In light of our recent growth report, it seems possible that Synektik Spólka Akcyjna's financial performance will exceed current levels.
- Get an in-depth perspective on Synektik Spólka Akcyjna's balance sheet by reading our health report here.
Taking Advantage
- Unlock our comprehensive list of 62 Undervalued European Stocks Based On Cash Flows by clicking here.
- Have you diversified into these companies? Leverage the power of Simply Wall St's portfolio to keep a close eye on market movements affecting your investments.
- Invest smarter with the free Simply Wall St app providing detailed insights into every stock market around the globe.
Ready For A Different Approach?
- Explore high-performing small cap companies that haven't yet garnered significant analyst attention.
- Diversify your portfolio with solid dividend payers offering reliable income streams to weather potential market turbulence.
- Fuel your portfolio with companies showing strong growth potential, backed by optimistic outlooks both from analysts and management.
This article by Simply Wall St is general in nature. We provide commentary based on historical data and analyst forecasts only using an unbiased methodology and our articles are not intended to be financial advice. It does not constitute a recommendation to buy or sell any stock, and does not take account of your objectives, or your financial situation. We aim to bring you long-term focused analysis driven by fundamental data. Note that our analysis may not factor in the latest price-sensitive company announcements or qualitative material. Simply Wall St has no position in any stocks mentioned.
Have feedback on this article? Concerned about the content? Get in touch with us directly. Alternatively, email editorial-team@simplywallst.com