
- PRICING
- LIVE QUOTES
- LEARN
- HELP


EN
AB Industrivärden (OM:INDU A) Swung To A Third Quarter Loss, Is It 72% Below Fair Value?
AB Industrivärden (OM:INDU A) just posted a mixed picture that matters for shareholders. The third quarter swung to a net loss, while the first nine months still show solid positive earnings.
Recent trading tells a mixed story. AB Industrivärden’s share price return is up 22.75% year to date and the 1 year total shareholder return is 34.95%. However, the 1 month share price return is down 5.96%, which hints that enthusiasm has cooled as the quarterly loss landed.
Scan how AB Industrivärden compares with other investment-led businesses by reviewing our hand picked list of solid balance sheet and fundamentals (204 results) that have held up under recent earnings pressure.
The recent pullback at AB Industrivärden could simply be sentiment catching its breath after strong multi year returns, or it could be markets reassessing that fresh quarterly loss. Which story does the valuation tell?
Price-to-Earnings of 4x: Is it justified?
On simple numbers, AB Industrivärden trades on a P/E of 4x, while the last close sits at SEK504.5. Against other listed investors in Europe, that headline multiple is far lower than the 9.9x industry average and it invites a closer look.
P/E compares what you pay per share with the earnings that AB Industrivärden generates per share. For an investment holding company that lives and dies by the value of its portfolio and the income it produces, this yardstick gives a quick sense of how much faith the market is placing in those earnings.
With a 4x P/E against a 9.9x industry yardstick, the stock is priced far more cheaply than a typical diversified financial peer. The peer comparison description also flags that AB Industrivärden trades below a 5.6x peer average, which points to a consistently lower earnings multiple rather than a marginal gap.
Analyst work on future cash flows tells a similar story in magnitude. The shares at SEK504.5 are described as trading 71.6% below an estimated future cash flow value of SEK1,777.77, and the SWS DCF model labels the stock as good value compared to that internal fair value view. While any DCF relies on assumptions about future cash flows and discount rates, the contrast between price and that SEK1,777.77 figure is wide.
For this sort of investment group, a P/E as compressed as 4x hints that the market is either heavily discounting the quality or sustainability of recent earnings, or demanding a significant margin of safety despite strong recent profit growth. Earnings grew very quickly over the past year and outpaced both the Swedish market and the diversified financial industry, yet the valuation description still places the shares well below the internal fair value estimate, which leaves P/E sitting on the low side of peers.
See what the numbers say about this price — find out in our valuation breakdown.
Result: Price-to-Earnings of 4x (UNDERVALUED)
Still, AB Industrivärden is highly exposed to swings in Nordic equity markets, and any sustained weakness could pressure both portfolio values and reported earnings.
Find out about the key risks to this AB Industrivärden narrative.
Another View: What The DCF Says About AB Industrivärden
That 4x P/E paints AB Industrivärden as cheap, and our DCF model points to something even starker. With the share price at SEK504.5 against an estimated future cash flow value of SEK1,777.77, the gap suggests investors are heavily discounting those projected inflows. This raises the question of whether sentiment is leaving too much on the table.
Look into how the SWS DCF model arrives at its fair value.
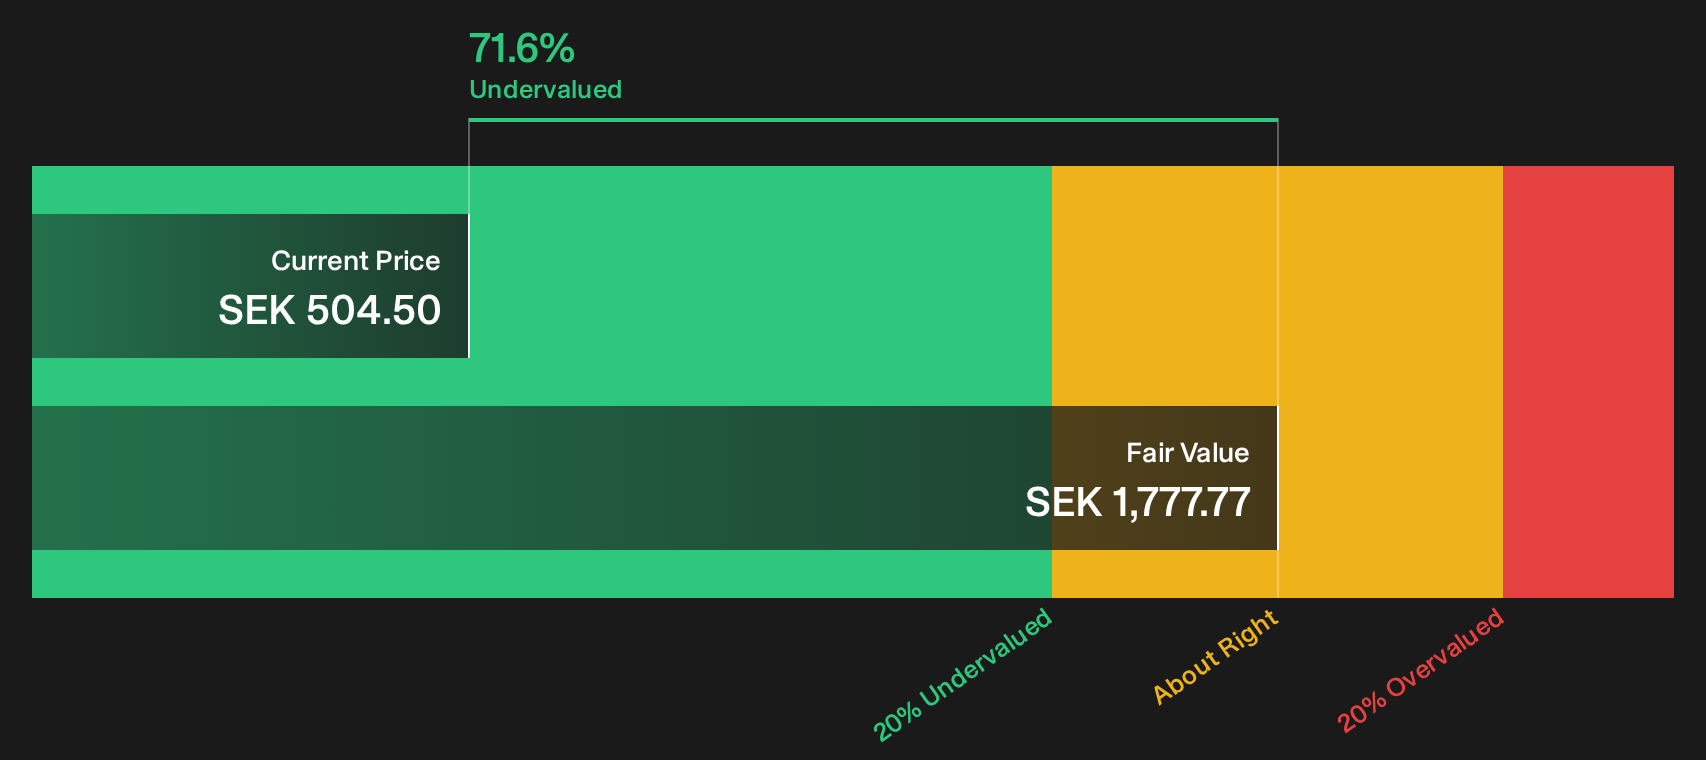
Simply Wall St performs a discounted cash flow (DCF) on every stock in the world every day (check out AB Industrivärden for example). We show the entire calculation in full. You can track the result in your watchlist or portfolio and be alerted when this changes, or use our stock screener to discover 178 high quality undervalued stocks. If you save a screener we even alert you when new companies match - so you never miss a potential opportunity.
Next Steps
Mixed signals can feel confusing, especially with AB Industrivärden showing both a recent quarterly loss and strong longer term returns. Act while the data is fresh and shape your own view by weighing both sides of the story, starting with the 2 key rewards and 2 important warning signs.
Looking for more investment ideas beyond AB Industrivärden?
If AB Industrivärden has sharpened your focus on valuation and risk, do not stop here. Use fresh data and clear filters to surface new candidates that might fit your approach before markets move on.
- Target potential mispricings by scanning for quality companies trading below what the numbers suggest through our 178 high quality undervalued stocks.
- Strengthen your income stream by reviewing a curated set of higher yielding payers using the 221 dividend fortresses.
- Dial down portfolio stress by concentrating on businesses with robust finances through the 223 resilient stocks with low risk scores.
This article by Simply Wall St is general in nature. We provide commentary based on historical data and analyst forecasts only using an unbiased methodology and our articles are not intended to be financial advice. It does not constitute a recommendation to buy or sell any stock, and does not take account of your objectives, or your financial situation. We aim to bring you long-term focused analysis driven by fundamental data. Note that our analysis may not factor in the latest price-sensitive company announcements or qualitative material. Simply Wall St has no position in any stocks mentioned.
Have feedback on this article? Concerned about the content? Get in touch with us directly. Alternatively, email editorial-team@simplywallst.com