
- PRICING
- LIVE QUOTES
- LEARN
- HELP


EN
International Petroleum (TSX:IPCO) Stock Looks Fully Priced On Current Earnings
International Petroleum has been a strong performer in recent years, which puts a spotlight on whether the current share price can still be explained by the earnings that support it. With that kind of backdrop, the key issue for you is how much of the good news on profits might already be reflected in the stock.
- International Petroleum has returned 383.4% over the past 5 years, which raises the question of how closely that rise tracks the development of its underlying earnings power.
- The business is heavily tied to converting its resource base into cash flow, so any shift in profitability or capital spending needs can meaningfully alter how much value investors place on each dollar of earnings.
- The analysts covering International Petroleum have run their own numbers. See what analysts think International Petroleum's shares could be worth.
The stock's next move may depend on whether International Petroleum's current share price lines up with what its earnings suggest is reasonable to pay today.
If you want to stress test whether International Petroleum's earnings based valuation question shows up elsewhere, it can help to compare it with companies in 8 high quality undervalued stocks.
Does International Petroleum Look Pricey on Earnings?
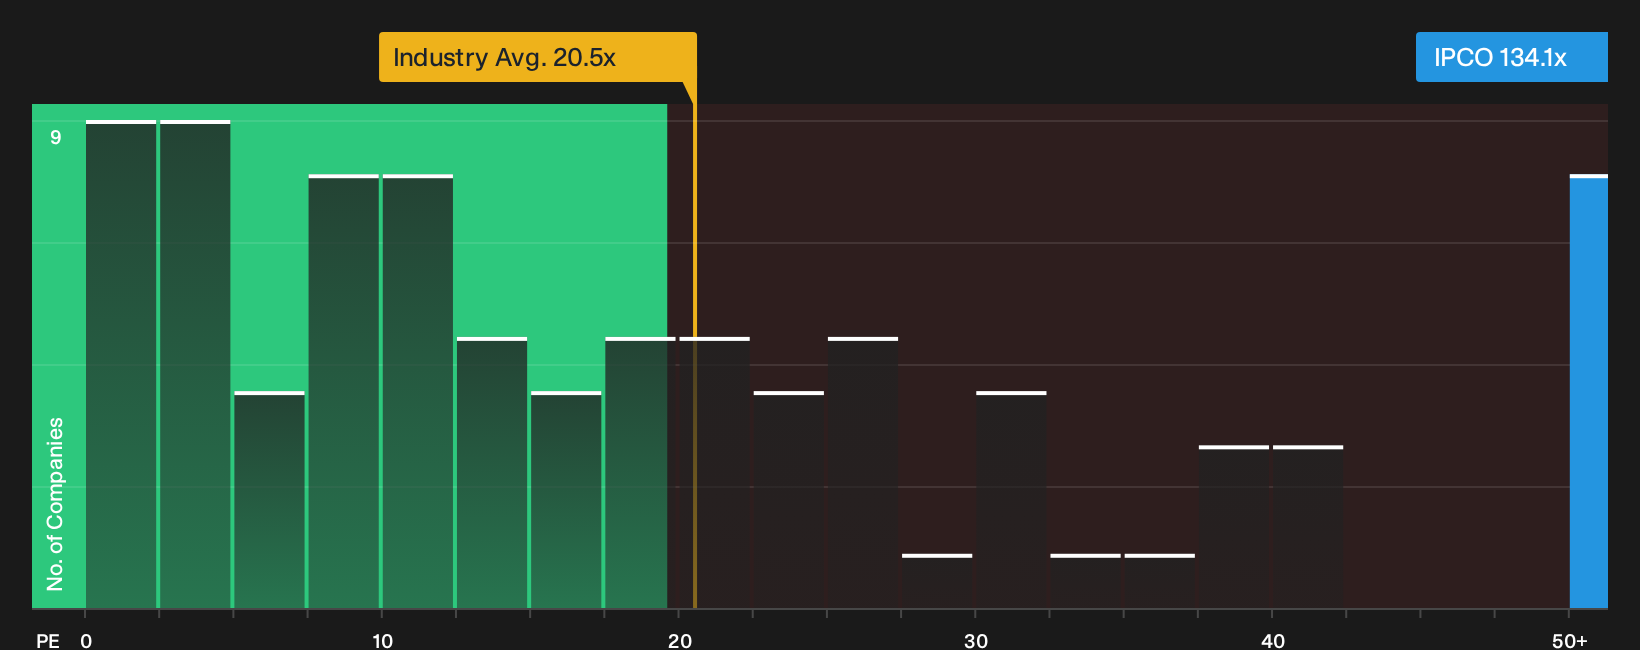
The P/E ratio is a useful lens for International Petroleum because earnings remain the core driver of how investors frame value for a mature oil and gas producer. On this measure, the share price currently trades on about 134.1x earnings, which is far higher than the Oil and Gas industry average of roughly 20.5x.
The tailored fair P/E multiple implied by the model comes in much lower than the current figure, and the gap is large enough that the output reads more like a caution flag than a tight estimate of fair value. In practical terms, International Petroleum stock screens as overvalued on earnings compared with what the model suggests for a business with its risk profile and cash generation record, even before you compare it with peers. The common thread across these benchmarks is that investors are paying a steep premium for each dollar of profit, which you would need to justify with a strong view on the company’s future earnings quality and durability. Explore the numbers behind International Petroleum's P/E valuation.
The International Petroleum Narrative: What Would Justify Today's Price?
Narratives on Simply Wall St pick up where this valuation puzzle leaves off by spelling out what would need to happen to International Petroleum's future growth, margins and earnings for the current share price to look meaningfully higher or lower than it does today.
Each scenario lays out the assumptions that sit behind its own view of fair worth, so you can keep track of those expectations as new results and announcements come through.
Investor debate on International Petroleum largely turns on how much weight to put on future cash generation from Blackrod versus current balance sheet and commodity risks.
Bull case: 23% undervalued
"Blackrod Phase 1 is close to completion, with US$820 million of the US$850 million budget already invested and first oil expected in 2026…"
Discover why this Narrative puts International Petroleum at 23% undervalued.
Bear case: roughly fairly valued
"The business exited 2025 with net debt of US$484 million after a year where free cash flow, after all growth capital, was a loss of US$153 million…"
Explore why this Narrative puts International Petroleum at roughly fairly valued.
One more piece to weigh on International Petroleum before you make a call
Before you lean too heavily on today’s P/E story for International Petroleum, it helps to see how professional analysts map out the next few years and where those expectations sit against this price. Explore where analysts expect International Petroleum to be in a few years.
This article by Simply Wall St is general in nature. We provide commentary based on historical data and analyst forecasts only using an unbiased methodology and our articles are not intended to be financial advice. It does not constitute a recommendation to buy or sell any stock, and does not take account of your objectives, or your financial situation. We aim to bring you long-term focused analysis driven by fundamental data. Note that our analysis may not factor in the latest price-sensitive company announcements or qualitative material. Simply Wall St has no position in any stocks mentioned.
Have feedback on this article? Concerned about the content? Get in touch with us directly. Alternatively, email editorial-team@simplywallst.com