
- PRICING
- LIVE QUOTES
- LEARN
- HELP


EN
Kakaku.com (TSE:2371) Weighs KDDI Capital Alliance Exit As Overvalued Narrative Holds
Kakaku.com (TSE:2371) has called a board meeting for 28 September 2026 to consider dissolving its capital alliance with KDDI CORPORATION, while keeping the business partnership in place and reassessing affiliated company relationships.
Recent trading has been supportive for Kakaku.com, with a 30 day share price return of 3.92% building on a 90 day gain of 5.79% and a year to date share price return of 68.49%. The 3 year total shareholder return of 198.50% highlights how longer term momentum has already been significant, even before this capital alliance rethink with KDDI CORPORATION came into focus.
Scan how Kakaku.com fits among other fast moving Japanese opportunities by checking companies on the 74 high quality undiscovered gems that pair strong fundamentals with under the radar share price momentum.
Kakaku.com now faces a fork in the road after its capital tie with KDDI CORPORATION comes under review. Does that recent surge justify stepping in today, or does patience around valuation make more sense?
Most Popular Narrative: 58% Overvalued
Kakaku.com last closed at ¥3,840, while the most followed narrative pegs fair value at ¥2,433.75. That gap frames the debate around whether recent gains and the KDDI capital alliance review leave expectations stretched.
Given the current share price of ¥3802.0, the analyst price target of ¥2433.75 is 56.2% lower. Despite analysts expecting the underlying business to improve, they seem to believe the market's expectations are too high.
See why 1 investors see Kakaku.com as 58% overvalued.
Result: Fair Value of ¥2,433.75 (OVERVALUED)
Still, the Kyujin Box segment guiding for negative profits and Kakaku.com’s heavy reliance on Kakaku.com and Tabelog leave the story exposed if user growth stalls.
Find out about the key risks to this Kakaku.com narrative.
Another View: Kakaku.com Through A Cash Flow Lens
Analysts using earnings multiples see Kakaku.com as 58% above their fair value estimate at ¥2,433.75. Our DCF model tells a different story. On that framework, the shares trade almost exactly in line with estimated future cash flows at about ¥3,845, with the current price of ¥3,840 sitting 0.1% below that mark.
The two methods deliver very different answers, so the question is which one better matches how you prefer to weigh growth against risk in a takeover heavy situation like this.
Look into how the SWS DCF model arrives at its fair value.
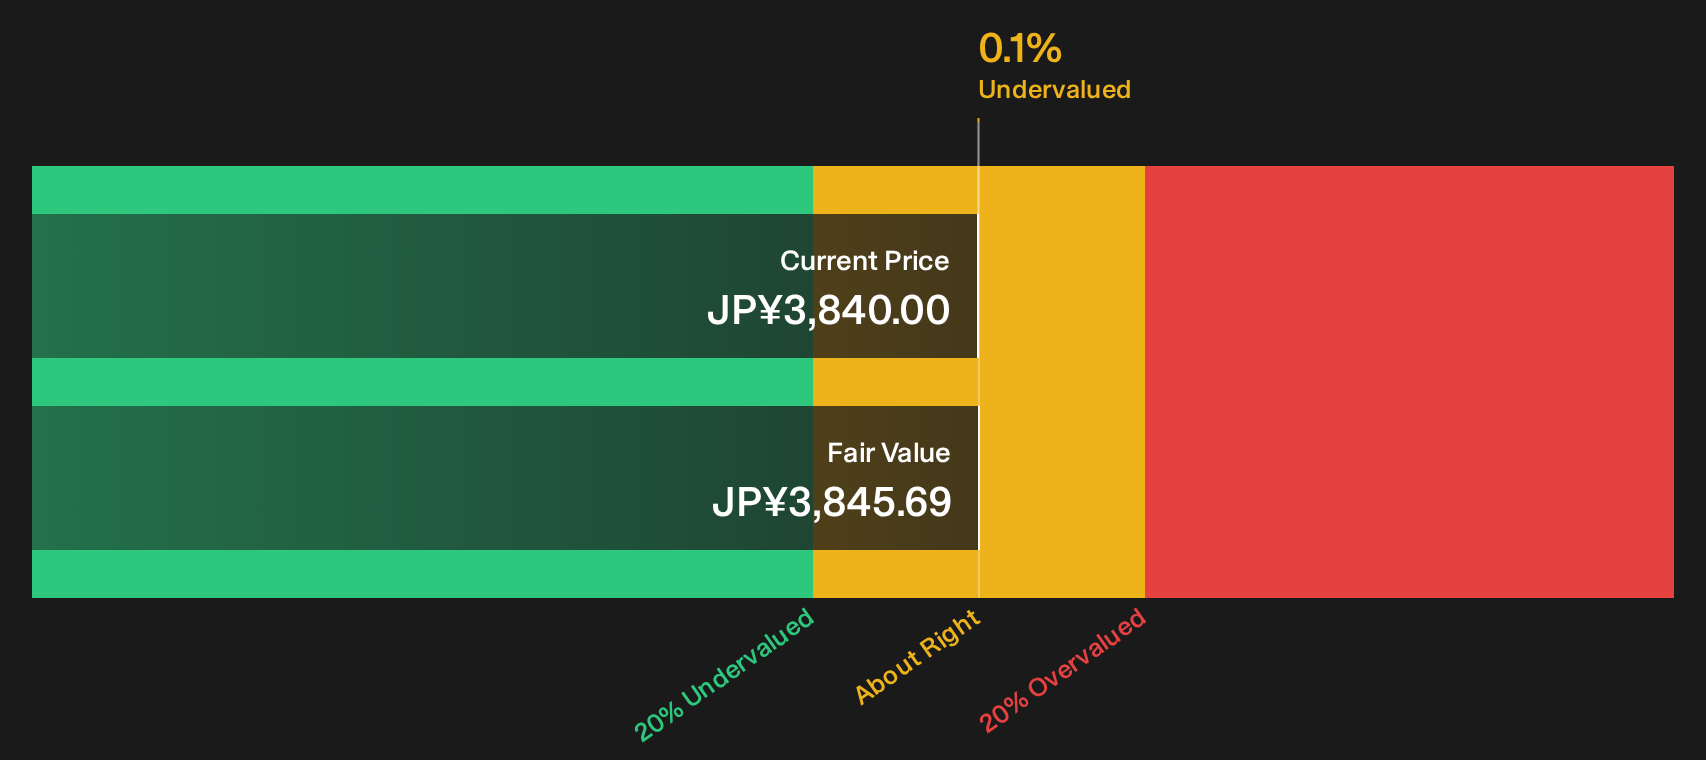
Simply Wall St performs a discounted cash flow (DCF) on every stock in the world every day (check out Kakaku.com for example). We show the entire calculation in full. You can track the result in your watchlist or portfolio and be alerted when this changes, or use our stock screener to discover 13 high quality undervalued stocks. If you save a screener we even alert you when new companies match - so you never miss a potential opportunity.
Next Steps
If the mixed signals around Kakaku.com leave you undecided, treat that as your cue to move fast and test the numbers yourself. Start by weighing the 2 key rewards against your own expectations for the business and see whether the optimism lines up with your thesis.
Looking for more investment ideas beyond Kakaku.com?
If Kakaku.com has sharpened your thinking, do not stop here. Cast the net wider and pressure test your thesis against fresh opportunities using focused screeners.
- Target resilience first and scan a 23 resilient stocks with low risk scores that filters for businesses with robust profiles when you want downside risk firmly under control.
- Hunt for quality at a discount and review the 13 high quality undervalued stocks to see which companies pair solid fundamentals with prices that lag underlying strength.
- Prioritise staying power and income by checking a 28 dividend fortresses where yields above 5% sit alongside an emphasis on stability.
This article by Simply Wall St is general in nature. We provide commentary based on historical data and analyst forecasts only using an unbiased methodology and our articles are not intended to be financial advice. It does not constitute a recommendation to buy or sell any stock, and does not take account of your objectives, or your financial situation. We aim to bring you long-term focused analysis driven by fundamental data. Note that our analysis may not factor in the latest price-sensitive company announcements or qualitative material. Simply Wall St has no position in any stocks mentioned.
Have feedback on this article? Concerned about the content? Get in touch with us directly. Alternatively, email editorial-team@simplywallst.com