
- PRICING
- LIVE QUOTES
- LEARN
- HELP


EN
Workiva (WK) Joins Key S And P Indexes, Is The Valuation Gap Still Compelling?
Workiva (WK) just joined several S&P indexes, including the S&P 600, S&P 1000 and S&P Composite 1500, a shift that can reshape how index-linked investors gain exposure to the stock.
Recent trading tells a mixed story for Workiva. The share price is up 34.31% over the past 90 days, while the year-to-date share price return is down 11.72% and the 1-year total shareholder return has declined 15.77%. This suggests that momentum has picked up in the short term, even as longer-term holders still sit on losses.
Scan how Workiva’s index move compares with other software players that also screen strongly on fundamentals through our hand picked list of solid balance sheet and fundamentals (25 results)
Workiva just rallied into new S&P indexes while still trading below both analyst targets and intrinsic estimates. Does that gap mark mispricing or a fair reflection of what the business is worth today?
Most Popular Narrative: 18% Undervalued
On the most followed narrative, Workiva’s fair value sits at $89.80 versus a last close of $73.25, which puts the story in clear focus for anyone weighing the recent index rally against longer term expectations.
Workiva's strategic push towards global expansion, with notable revenue growth from international markets, highlights an opportunity to increase total revenues as they penetrate less saturated markets outside the Americas.
The continued integration and success of AI capabilities within Workiva's platform is expected to improve operational efficiencies, potentially boosting net margins by streamlining workflows and increasing customer engagement.
See why 7 investors see Workiva as 18% undervalued.
Result: Fair Value of $89.80 (UNDERVALUED)
Still, this bullish Workiva narrative leans heavily on regulatory tailwinds and partner execution; both could disappoint if rules shift or implementation quality slips.
Find out about the key risks to this Workiva narrative.
Another View: What Workiva’s P/E Ratio Is Saying
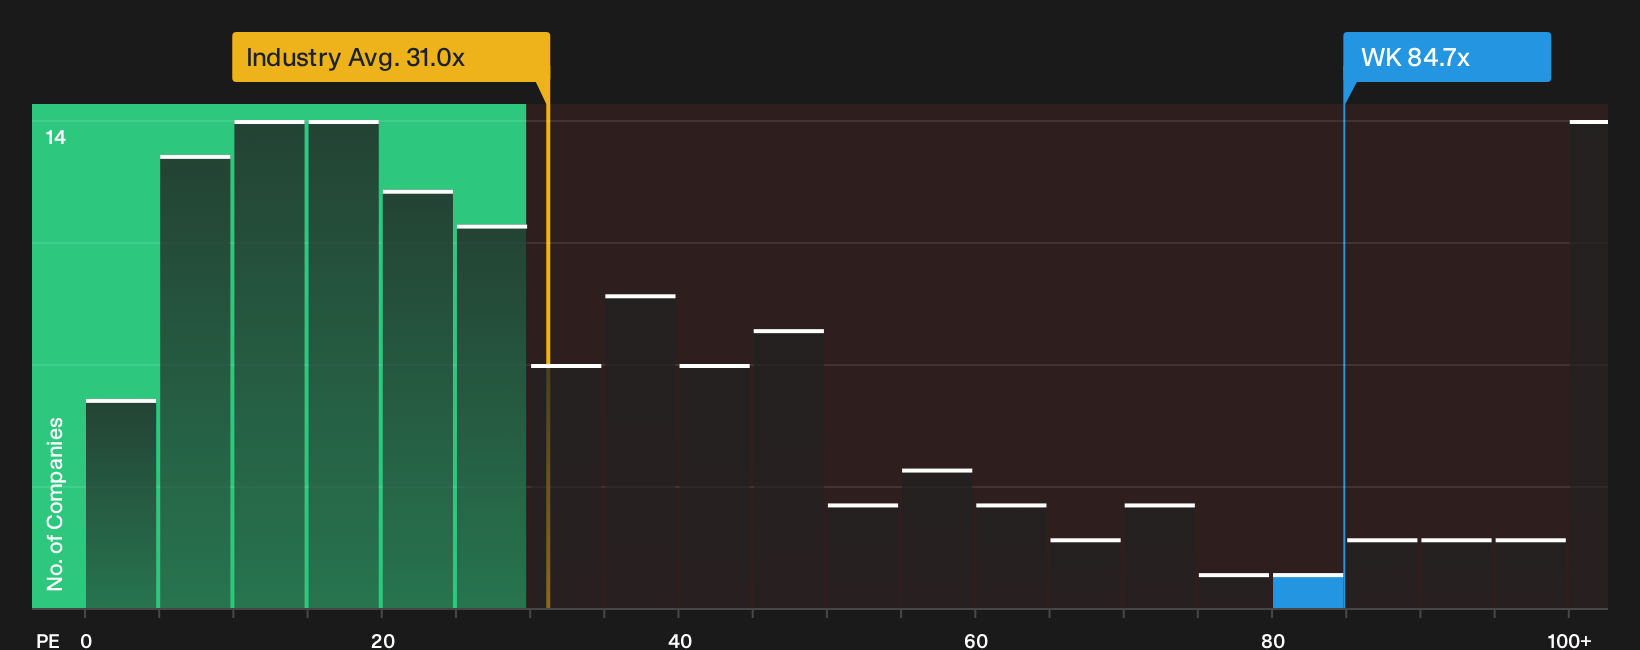
Valuation based on fair value estimates paints Workiva as cheap, yet the current P/E of 84.7x tells a very different story. That multiple is far above the US software industry at 31x, the peer group at 49x, and even the fair ratio of 39.6x that the market could move toward.
If sentiment cools and the P/E drifts closer to that 39.6x fair ratio or to sector norms, the share price would have a lot of premium to shed, which raises the question of how much valuation risk investors are willing to carry for this growth profile.
See what the numbers say about this price — find out in our valuation breakdown.
Next Steps
Sentiment on Workiva is clearly split, with some investors focused on upside potential and others zeroing in on red flags. If you want to move fast and build your own view using the same data set, start by weighing the 4 key rewards and 3 important warning signs.
Looking for more investment ideas beyond Workiva?
If Workiva has sharpened your thinking, do not stop here. Broaden your watchlist with data driven ideas that could reshape how you allocate your next dollar.
- Target potential upside by scanning a curated set of companies that combine quality and attractive pricing through our 29 high quality undervalued stocks.
- Prioritize resilience by reviewing a 31 resilient stocks with low risk scores that focuses on businesses with more stable risk profiles.
- Hunt for underfollowed opportunities by checking the 20 high quality undiscovered gems that highlight strong fundamentals away from the crowded trades.
This article by Simply Wall St is general in nature. We provide commentary based on historical data and analyst forecasts only using an unbiased methodology and our articles are not intended to be financial advice. It does not constitute a recommendation to buy or sell any stock, and does not take account of your objectives, or your financial situation. We aim to bring you long-term focused analysis driven by fundamental data. Note that our analysis may not factor in the latest price-sensitive company announcements or qualitative material. Simply Wall St has no position in any stocks mentioned.
Have feedback on this article? Concerned about the content? Get in touch with us directly. Alternatively, email editorial-team@simplywallst.com