
- PRICING
- LIVE QUOTES
- LEARN
- HELP


EN
How Earnings Upgrades Will Impact Allstate Stock
- Recent reports indicate Allstate has seen earnings estimates revised upward as analysts highlight higher pre-tax profit margins, efficiency gains and continued share repurchases.
- The company’s push into mobile app leadership and broader digital insurance tools points to a tighter, more data driven operating model for its protection platform.
- This section examines how Allstate's higher pre-tax profit margins may influence the investment narrative around its long term earnings power.
Allstate Investment Narrative Recap
To own Allstate, you need to believe the insurance group can keep turning its AI driven pricing, tighter expense base and digital distribution into resilient underwriting results while weather and legal costs stay manageable. The recent earnings upgrades and margin improvement speak directly to that thesis. The key near term swing factor remains how well underwriting and catastrophe exposure hold up against elevated storm losses.
The biggest threat is still catastrophe volatility and regulatory pushback on pricing, not this earnings revision cycle itself. Higher estimated profitability and share repurchases do not remove that risk, but they give the business more room to keep investing in analytics, Protection Services and its app led experience if conditions stay broadly similar.
The clearest recent data point tied to this story is the expansion in Allstate's pre tax profit margin over the last two years, alongside stronger efficiency and continued buybacks. That margin profile is what analysts are now marking into earnings models. For investors, the key operational question is whether those levels prove durable as catastrophe losses and claim trends evolve.
Higher profitability combined with a P/E of 4.4x, a 1.88% dividend and active share repurchases reflects the current financial capacity the insurer has to keep funding its Affordable, Simple, Connected products and AI tools. If catastrophe costs or regulatory outcomes such as the Oklahoma lawsuit move against Allstate, that same financial flexibility will be tested quickly.
Allstate Consensus Assumptions And What They Really Mean
Analysts sketch a very different long run picture for Allstate than the recent earnings upgrades might suggest. The consensus view in the Simply Wall St extract has top line growth running at 2.7% a year over the next three years, while profit margins move from 18.8% today to 5.1% in 2029. That combination bakes in a smaller profit pool on a larger revenue base, which is an important contrast to the current narrative around higher pre tax profitability.
The same projections point to earnings of US$3.9b by 2029 compared with US$13.2b today, even as analysts model continued share count reduction of 3.37% a year for the next three years. In other words, the market research is not calling for earnings growth; it is sketching a materially leaner profit line supported by buybacks and a lower margin structure. Readers weighing Allstate against other insurers need to keep that disconnect in mind when comparing simple valuation multiples that look cheap against today’s results.
To make those earnings numbers support the analyst price targets, the stock would need to trade at a P/E of 19.8x on 2029 earnings compared with about 4.3x today and an industry level of 10.6x for US insurers. That is a big shift in what investors would be willing to pay for each dollar of earnings. The story on paper is that the business could be smaller in earnings terms by 2029, yet the consensus framework assumes the market assigns a much richer multiple to that lower profit base.
For income focused readers, the current valuation context matters. A P/E around 4.4x, a 1.88% dividend yield and active buybacks reflect significant present day capacity to return capital. The analyst template says that same stream of owner returns could coexist with declining earnings, guided by a discount rate assumption of roughly 7.2% to 7.24% in the Simply Wall St model. Whether that trade off appeals comes down to each investor’s view on how catastrophe exposure, regulation and Allstate's digital operating model interact over the next several years.
Allstate's narrative projects US$76.0b revenue and US$3.9b earnings by 2029. This implies 2.7% yearly revenue growth and an earnings decrease of US$9.3b from US$13.2b today.
Uncover why Allstate's fair value indicates a 20% potential upside to its current price that could narrow quickly.
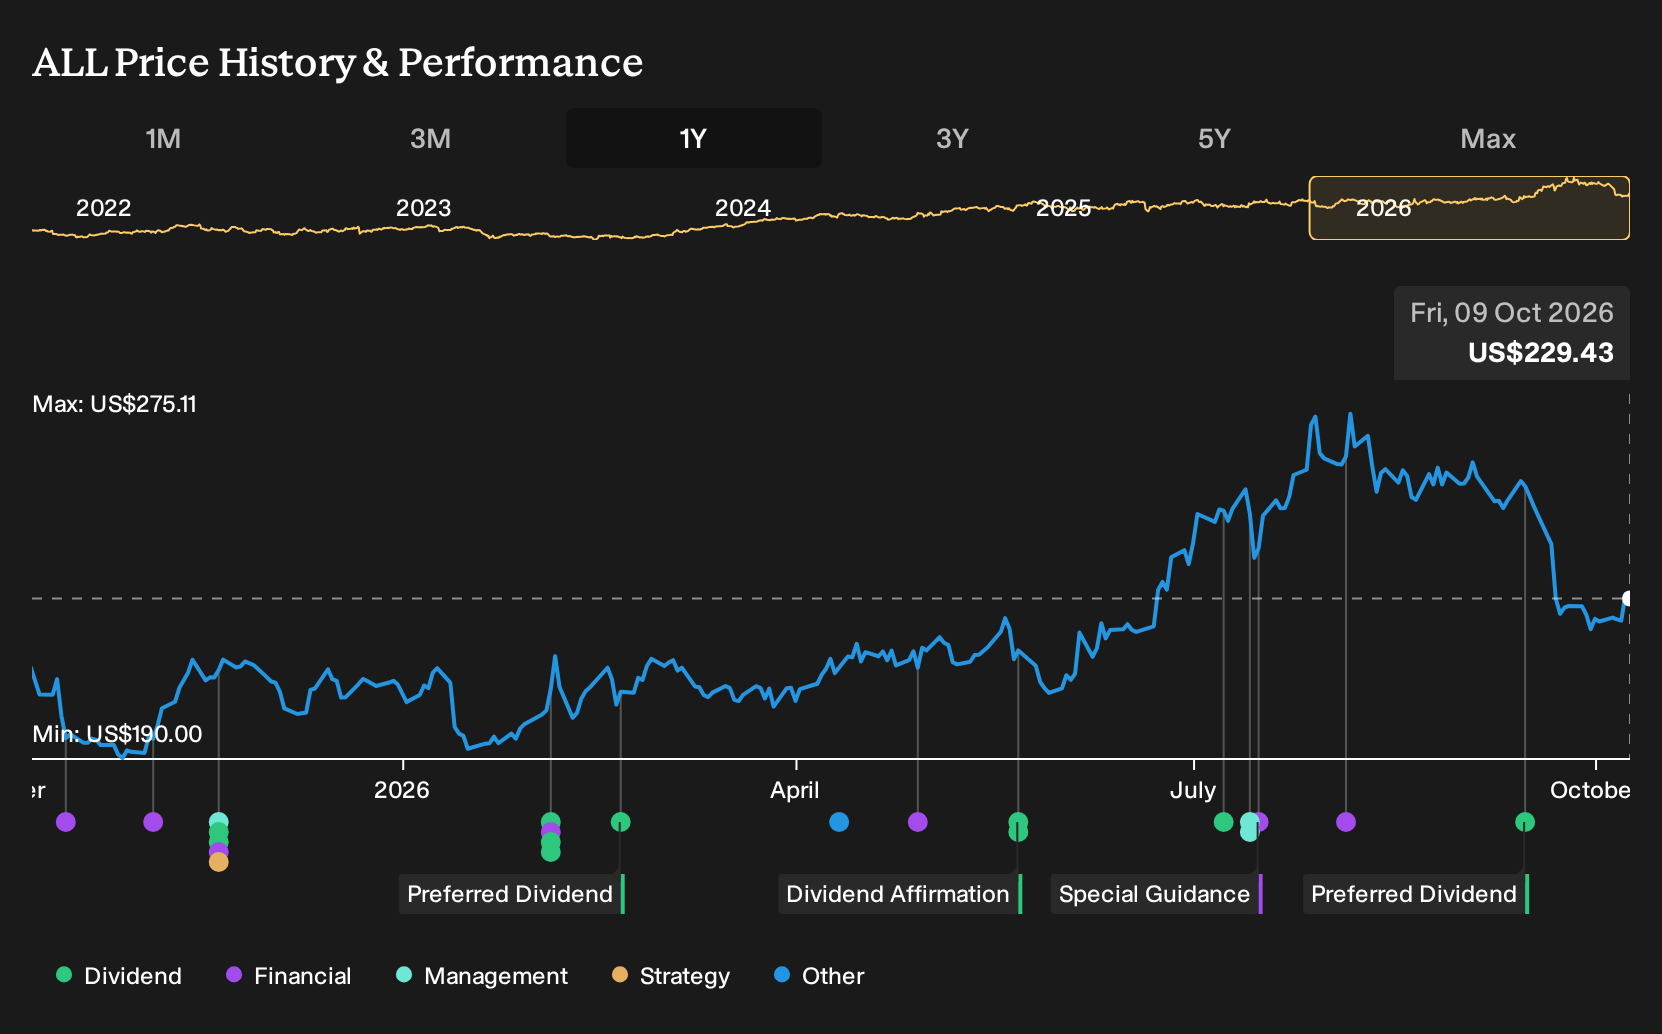
Exploring Other Perspectives
One alternate view sees the recent catastrophe pattern as the real swing factor for Allstate. Before this news, the most bearish analysts were already penciling in slower revenue progress, only about 1.2% a year, and earnings of roughly US$3.9b by 2029. That is far more cautious than consensus. It shows how far opinions can spread. Use these numbers as a starting point to explore several different scenarios for Allstate's future rather than locking into a single story.
Explore 5 other Allstate fair value estimates, including one that suggests as much as 10% downside from the current price.
Form Your Own Verdict
Disagree with existing narratives? Extraordinary investment outcomes rarely come from following the herd, so trust your own analysis.
- A great starting point for your Allstate research is our analysis highlighting 4 key rewards and 2 important warning signs that could impact your investment decision.
- See our latest analysis for Allstate. The report includes a comprehensive fundamental analysis summarized in a single visual, the Snowflake, making it easier to review Allstate's overall financial health at a glance.
Looking For More Investment Ideas Beyond Allstate?
If Allstate's risk and return trade offs have sharpened your thinking, it can help to set it alongside other businesses with different balance sheet strength, payout profiles and valuation markers. The Simply Wall St screener makes that comparison easier by surfacing focused lists that match the type of opportunities you want to study next.
- If capital protection sits high on your list, filter for steadier businesses through a 31 resilient stocks with low risk scores that keep downside risk scores in check while still offering room for returns.
- For readers who want reliable cash returns alongside potential price moves, scan a 8 dividend fortresses that concentrates on higher yielding payers with room to support distributions.
- When the goal is to spot under the radar opportunities with solid fundamentals, work through a curated 20 high quality undiscovered gems that many investors may not be watching yet.
This article by Simply Wall St is general in nature. We provide commentary based on historical data and analyst forecasts only using an unbiased methodology and our articles are not intended to be financial advice. It does not constitute a recommendation to buy or sell any stock, and does not take account of your objectives, or your financial situation. We aim to bring you long-term focused analysis driven by fundamental data. Note that our analysis may not factor in the latest price-sensitive company announcements or qualitative material. Simply Wall St has no position in any stocks mentioned.
Have feedback on this article? Concerned about the content? Get in touch with us directly. Alternatively, email editorial-team@simplywallst.com