
- PRICING
- LIVE QUOTES
- LEARN
- HELP


EN
MVV Energie (XTRA:MVV1), What Is Behind The Fresh Attention?
MVV Energie (XTRA:MVV1) has come under fresh review after its intrinsic discount was updated to 0.97, highlighting a tension between a high 46.4x P/E ratio and a discounted cash flow model that identifies the shares as heavily undervalued.
Recent trading tells a mixed story. The share price is roughly flat over the past quarter, yet the 1-year total shareholder return of 3.8% and 5-year total shareholder return of 15.9% point to steady, if unspectacular, progress as investors weigh MVV Energie’s rich P/E tag against the discounted cash flow signal of undervaluation.
Compare MVV Energie’s rich P/E and DCF mismatch with other potential value ideas by scanning our hand picked 174 high quality undervalued stocks that combine solid balance sheets with attractive pricing signals.
MVV Energie trades on a rich 46.4x P/E, yet the updated intrinsic discount of roughly 97% points to deep undervaluation. Is the cautious market right, or is the pricing model missing something important?
Price-to-Earnings of 46.5x: Is it justified?
MVV Energie’s valuation signal from the preferred metric is clear. The stock trades on a P/E of roughly 46.5x at a last close of €30.4, while peers in the German Integrated Utilities industry sit much lower, so the shares screen as expensive on this yardstick.
The P/E ratio compares today’s share price to the most recent earnings per share. For a utility group like MVV Energie, it reflects what investors are prepared to pay for each euro of current profit in a sector that often features regulated returns and relatively steady cash generation.
On this measure, investors are paying a premium multiple compared with similar sized peers. The data shows MVV Energie on a 46.5x P/E compared with a peer average of 14.5x and a global Integrated Utilities average of 17.8x, which is a strong signal that the market is pricing in more optimistic expectations than for the wider group.
See what the numbers say about this price — find out in our valuation breakdown.
Result: Price-to-earnings of 46.5x (OVERVALUED).
Still, a 46.5x P/E can quickly look fragile if MVV Energie sees earnings pressure or if regulatory changes cap returns for core utility activities.
Find out about the key risks to this MVV Energie narrative.
Another view on MVV Energie’s value
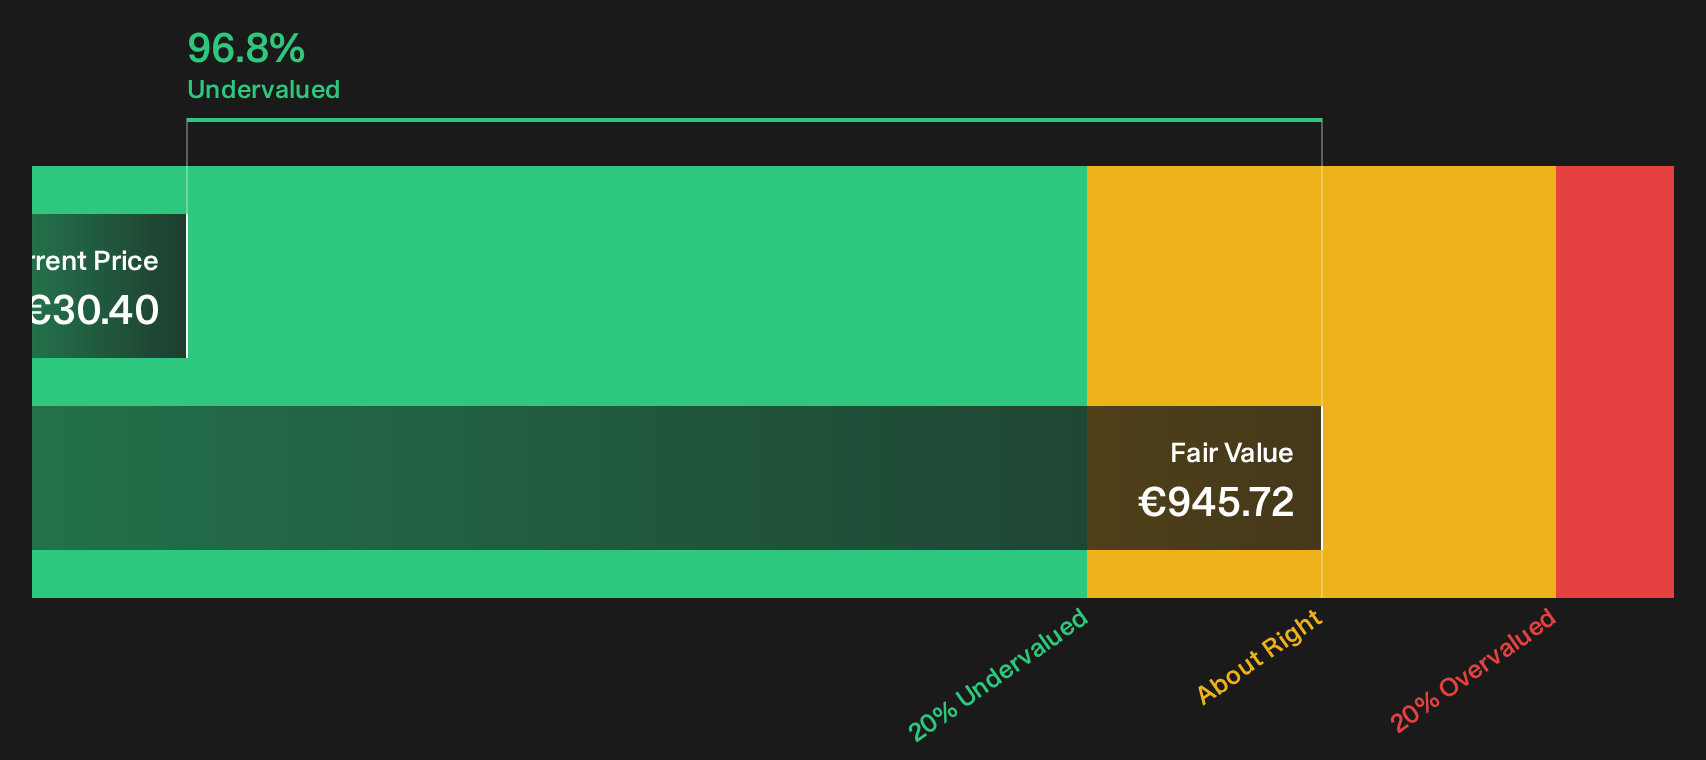
The DCF work points in the opposite direction to the rich P/E. Our DCF model values MVV Energie at about €945.72 per share versus a market price of €30.4, which implies the stock trades roughly 96.8% below that estimate. Is this a rare mispricing or a model that is too optimistic about future cash flows?
Look into how the SWS DCF model arrives at its fair value.
Simply Wall St performs a discounted cash flow (DCF) on every stock in the world every day (check out MVV Energie for example). We show the entire calculation in full. You can track the result in your watchlist or portfolio and be alerted when this changes, or use our stock screener to discover 174 high quality undervalued stocks. If you save a screener we even alert you when new companies match - so you never miss a potential opportunity.
Next Steps
Unsure which signal to trust on MVV Energie after weighing the rich P/E against the steep DCF discount and the mixed sentiment around it. Act quickly by checking the underlying data, then balance both sides of the story by reviewing the 1 key reward and 4 important warning signs.
Looking for more investment ideas beyond MVV Energie?
MVV Energie gives useful signals, but your next strong opportunity might be sitting somewhere else on the market. Use targeted screens to quickly surface fresh ideas that match your risk and income preferences.
- Target higher income potential by scanning companies in the 223 dividend fortresses that already offer elevated yields with a focus on durability.
- Reduce stress on capital by filtering for the 222 resilient stocks with low risk scores that score well on financial strength and volatility checks.
- Hunt for future leaders early by zeroing in on the 618 high quality undiscovered gems before attention and pricing catch up.
This article by Simply Wall St is general in nature. We provide commentary based on historical data and analyst forecasts only using an unbiased methodology and our articles are not intended to be financial advice. It does not constitute a recommendation to buy or sell any stock, and does not take account of your objectives, or your financial situation. We aim to bring you long-term focused analysis driven by fundamental data. Note that our analysis may not factor in the latest price-sensitive company announcements or qualitative material. Simply Wall St has no position in any stocks mentioned.
Have feedback on this article? Concerned about the content? Get in touch with us directly. Alternatively, email editorial-team@simplywallst.com